
If you work within the digital marketing industry, do you ever wonder how your company’s compensation practices stack up? Accurate salary data from the marketing industry can be difficult to find. NP Digital’s recent survey sheds some light on U.S. and global digital marketing salaries.
We surveyed more than 3,700 digital marketing professionals across hundreds of countries to uncover the latest salary trends in the industry. Whether you work with Fortune 500 companies or mom-and-pop operations, NP Digital’s research has essential salary info for every geographic and occupational group.
In our survey, you’ll discover:
- The average earnings for several digital marketing roles across different verticals.
- How key factors like experience and company size impact salary.
- Whether salary really is the main indicator of job satisfaction.
While many discussions around salary live behind closed doors, transparency can help ensure digital marketers receive fair compensation for their hard work. These survey statistics pull back the curtain so you can determine if it’s time to ask about that raise.
The Essentials Everyone Should Know About Digital Marketing Salary Trends
- The average digital marketing professional from the U.S. had an average yearly overall compensation of $86.9K.
- Globally, the average was $53.6K.
- The U.S. average may be bolstered by a relatively small percentage of extremely high salaries.
- U.S. had, by far, the highest percentage of respondents who said they work remotely, at 54.7 percent.
- This was followed by India (13.6 percent) and Canada (8.4 percent).
- In the U.S., the highest-compensated positions were growth-oriented roles, strategic/top-level management, and strategy-oriented roles.
- The lowest were e-commerce, social media, and copywriter.
- In the U.S., despite the industry having more women overall, men earned more across every level of seniority. Men were also far more represented at the senior level.
- Freelancers had the biggest pay gaps, with men making more.
- Globally, those satisfied with their compensation packages cited flexible hours as their most valued benefit, followed by remote work.
- Low salary or compensation was the most common reason globally why digital marketing professionals left their roles.
- For younger age groups, lack of growth opportunities was also a major issue.
- Work-life balance and seeking new challenges or more interesting work were recurring issues that would cause people to leave.
Table of Contents
U.S.-Only Data
What Are U.S. Digital Marketers Making?
What Factors Are Impacting U.S. Digital Marketer Salaries?
Global Data
How Is Global Digital Marketing Compensation Impacted By Outside Factors?
How Employee Location Trends Are Changing Globally
Are Marketers Discussing Compensation?
What Impacts Raises In Compensation?
Why,Might Digital Marketing Professionals Leave Their Jobs?
U.S. vs. Global Data
U.S. vs. Global: Do We See Salary Differences?
Insights
What Can Digital Marketing Companies Learn From Our Findings?
What Are U.S. Digital Marketers Making?
As one of the major digital marketing hubs worldwide, the U.S. sets the trend for the overall market—so let’s start there.
Respondents from the U.S. had an average overall compensation of $86,931 for their digital marketing roles. One key thing to keep in mind is that compensation ranges varied widely, signaling large pay differences depending on the specific job and niche.
In addition, U.S. compensation distribution results might have been swayed heavily by the highest salaries. As we will see later on, this means a lower floor for the lower-level salaries.
What Factors Are Impacting U.S. Digital Marketing Salaries?
We’ve established what the baseline compensation looks like for the U.S. digital marketing world. But when we start sorting workers by category, how do different factors impact compensation? Let’s take a look at some of the most important areas.
Experience
The general consensus is that the longer you’ve worked in digital marketing, the more money you can expect to receive. However, this isn’t as clear-cut as it seems.
To start, let’s take a look at the below chart:
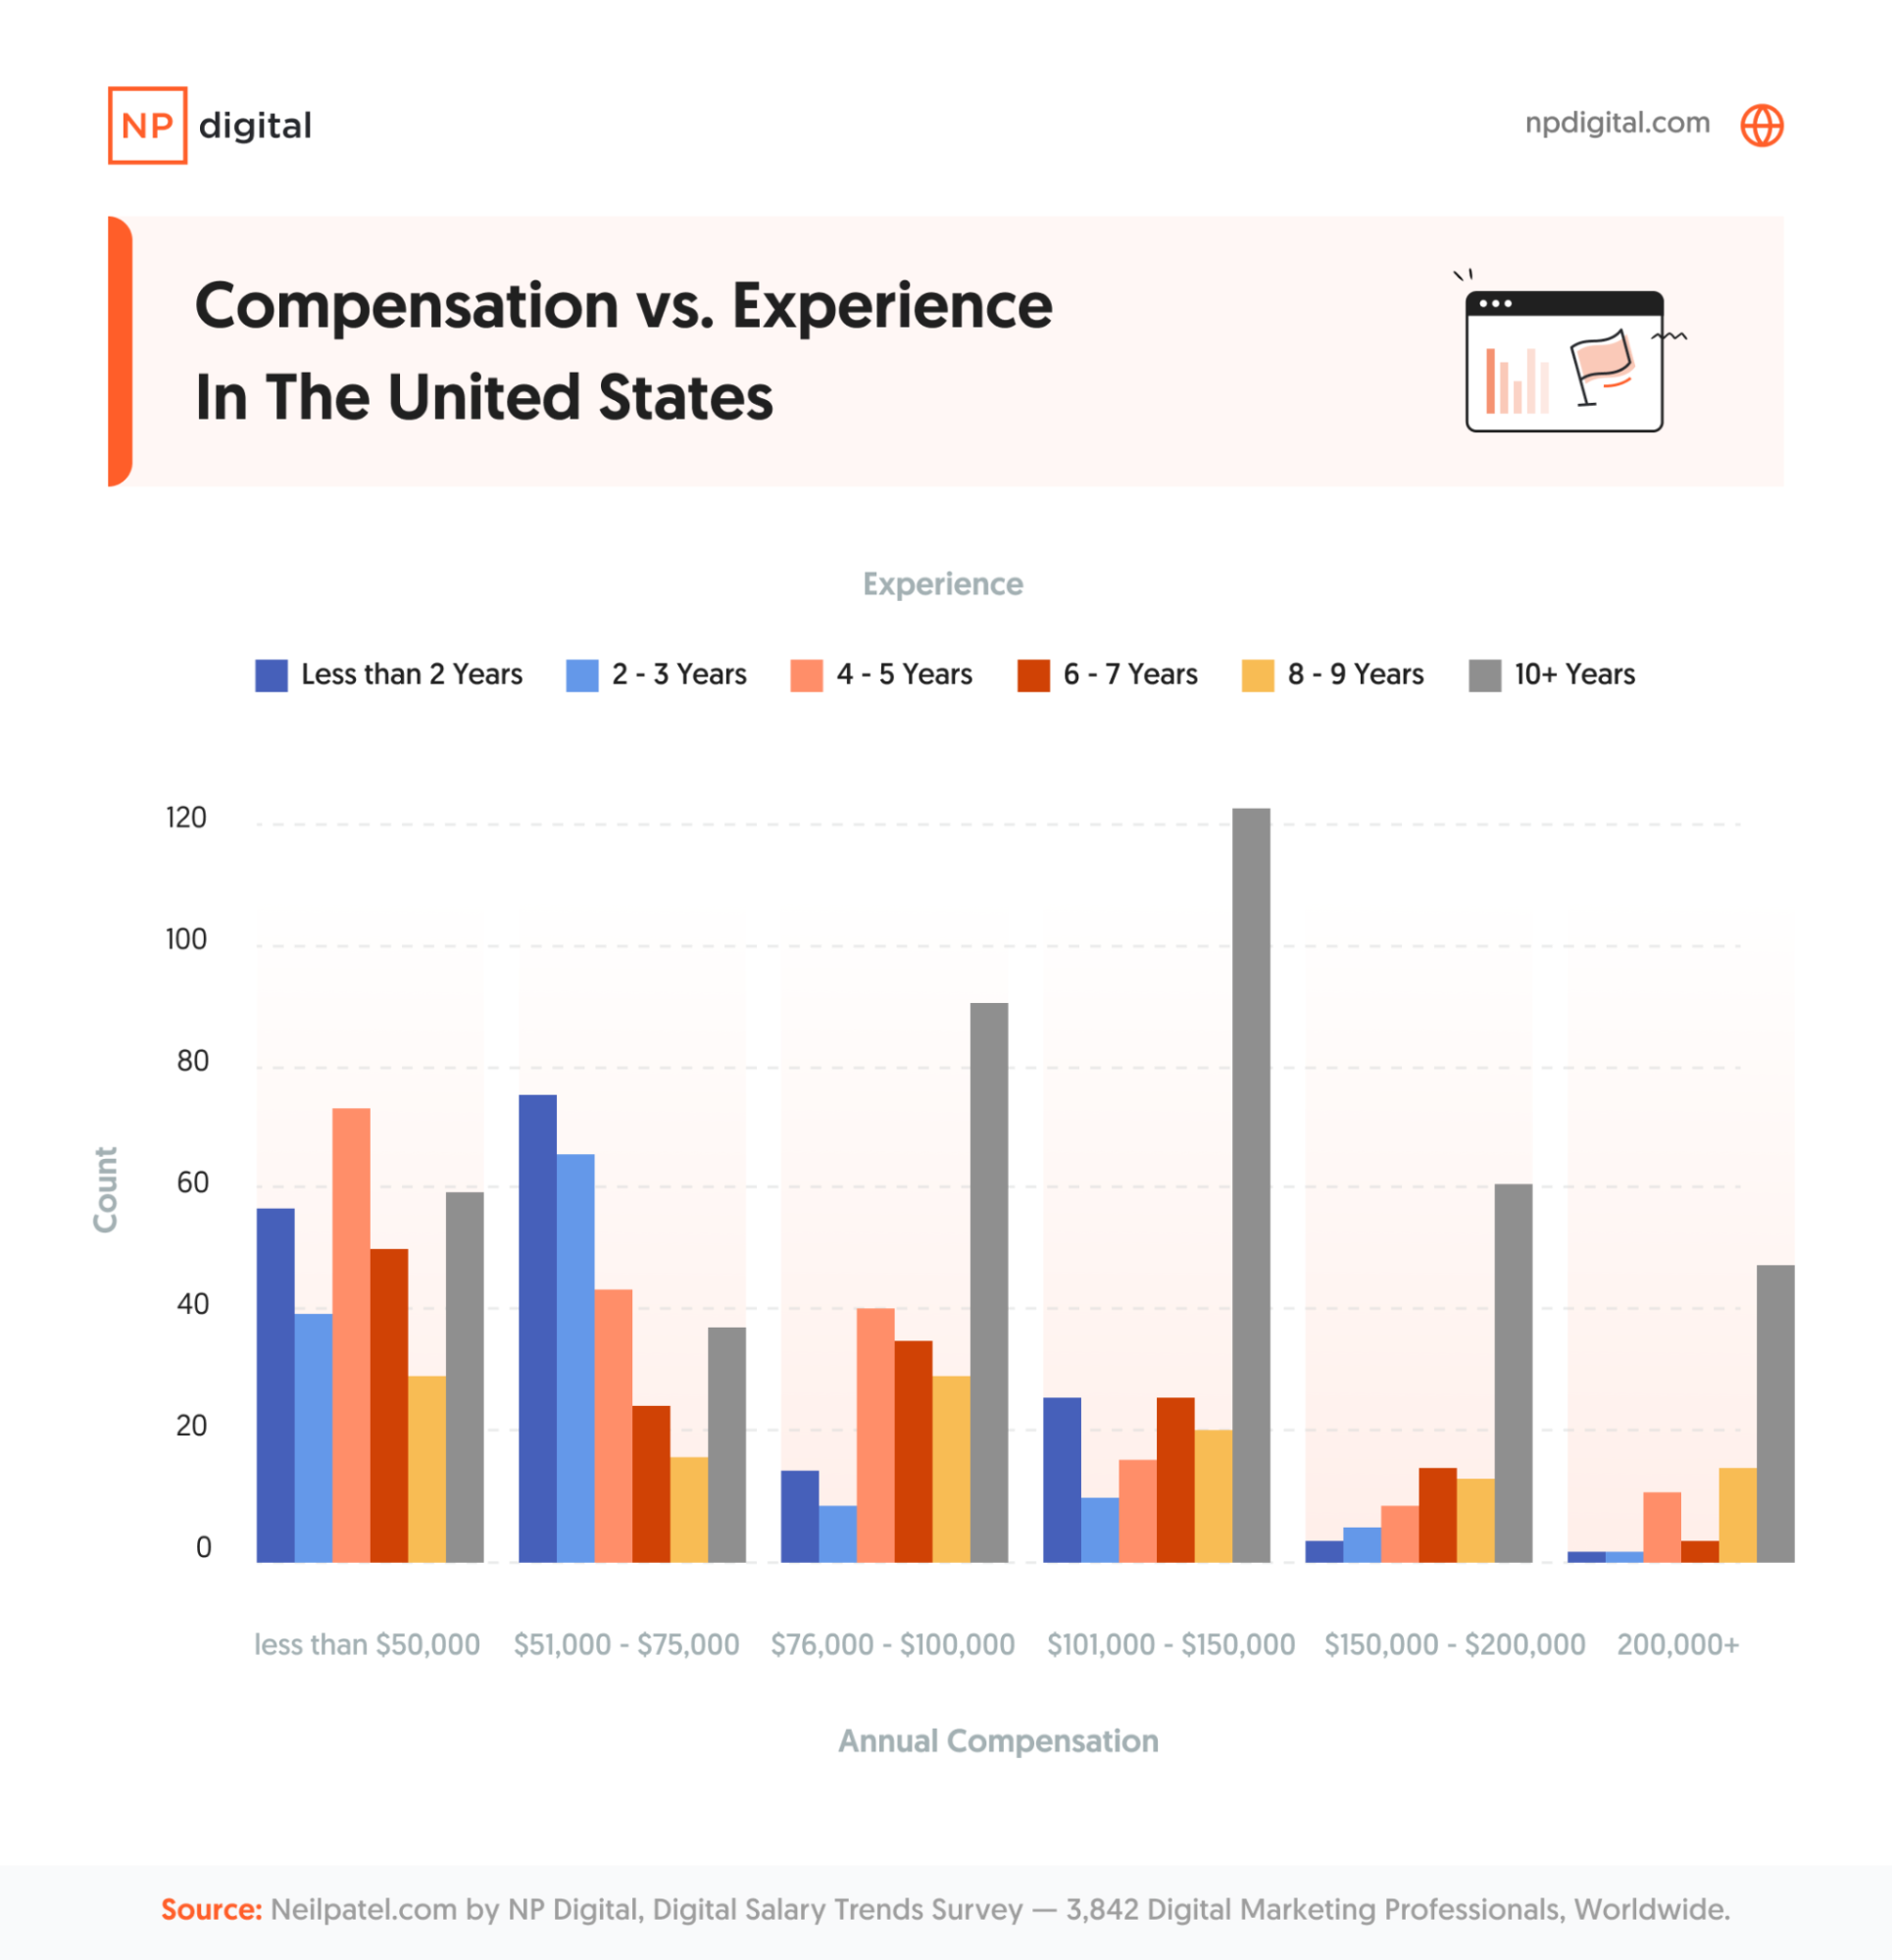
Despite a higher overall average, a notable group of respondents said they earn less than $50,000 annually. While a large group in this category say they have less than two years of experience, there are more experienced professionals who also make less than $50,000.
Those with four to five years of experience had the largest representation in this category. This might suggest some of their industries do not pay much, or that digital marketing is a side job for them. With that said, the evidence shows that experience does not guarantee high compensation overall.
One interesting note is that when we look at the $76,000-$100,000 compensation bracket, there is a wide variety of experience levels, albeit trending toward more than 10 years of experience. This suggests that it’s feasible to earn a decent salary relatively early in one’s career in the marketing world. There might also be outside factors—such as education or role type—that influence earning power in the mid-stages of a digital marketing career.
However, the $101,000 and above brackets have disproportionately high percentages of marketers with more than 10 years of experience.
Work Location
The digital marketing world saw a large shift toward remote work—and nowhere was this felt more than in the U.S. Of all the respondents who said they work remotely, the highest percentage was from the U.S. at 54.7 percent.
So, does the decision to work remotely or in-person impact compensation? Our findings were intriguing. Compared with other countries, the U.S. had a diverse compensation range for remote jobs, as you can see in the chart below.
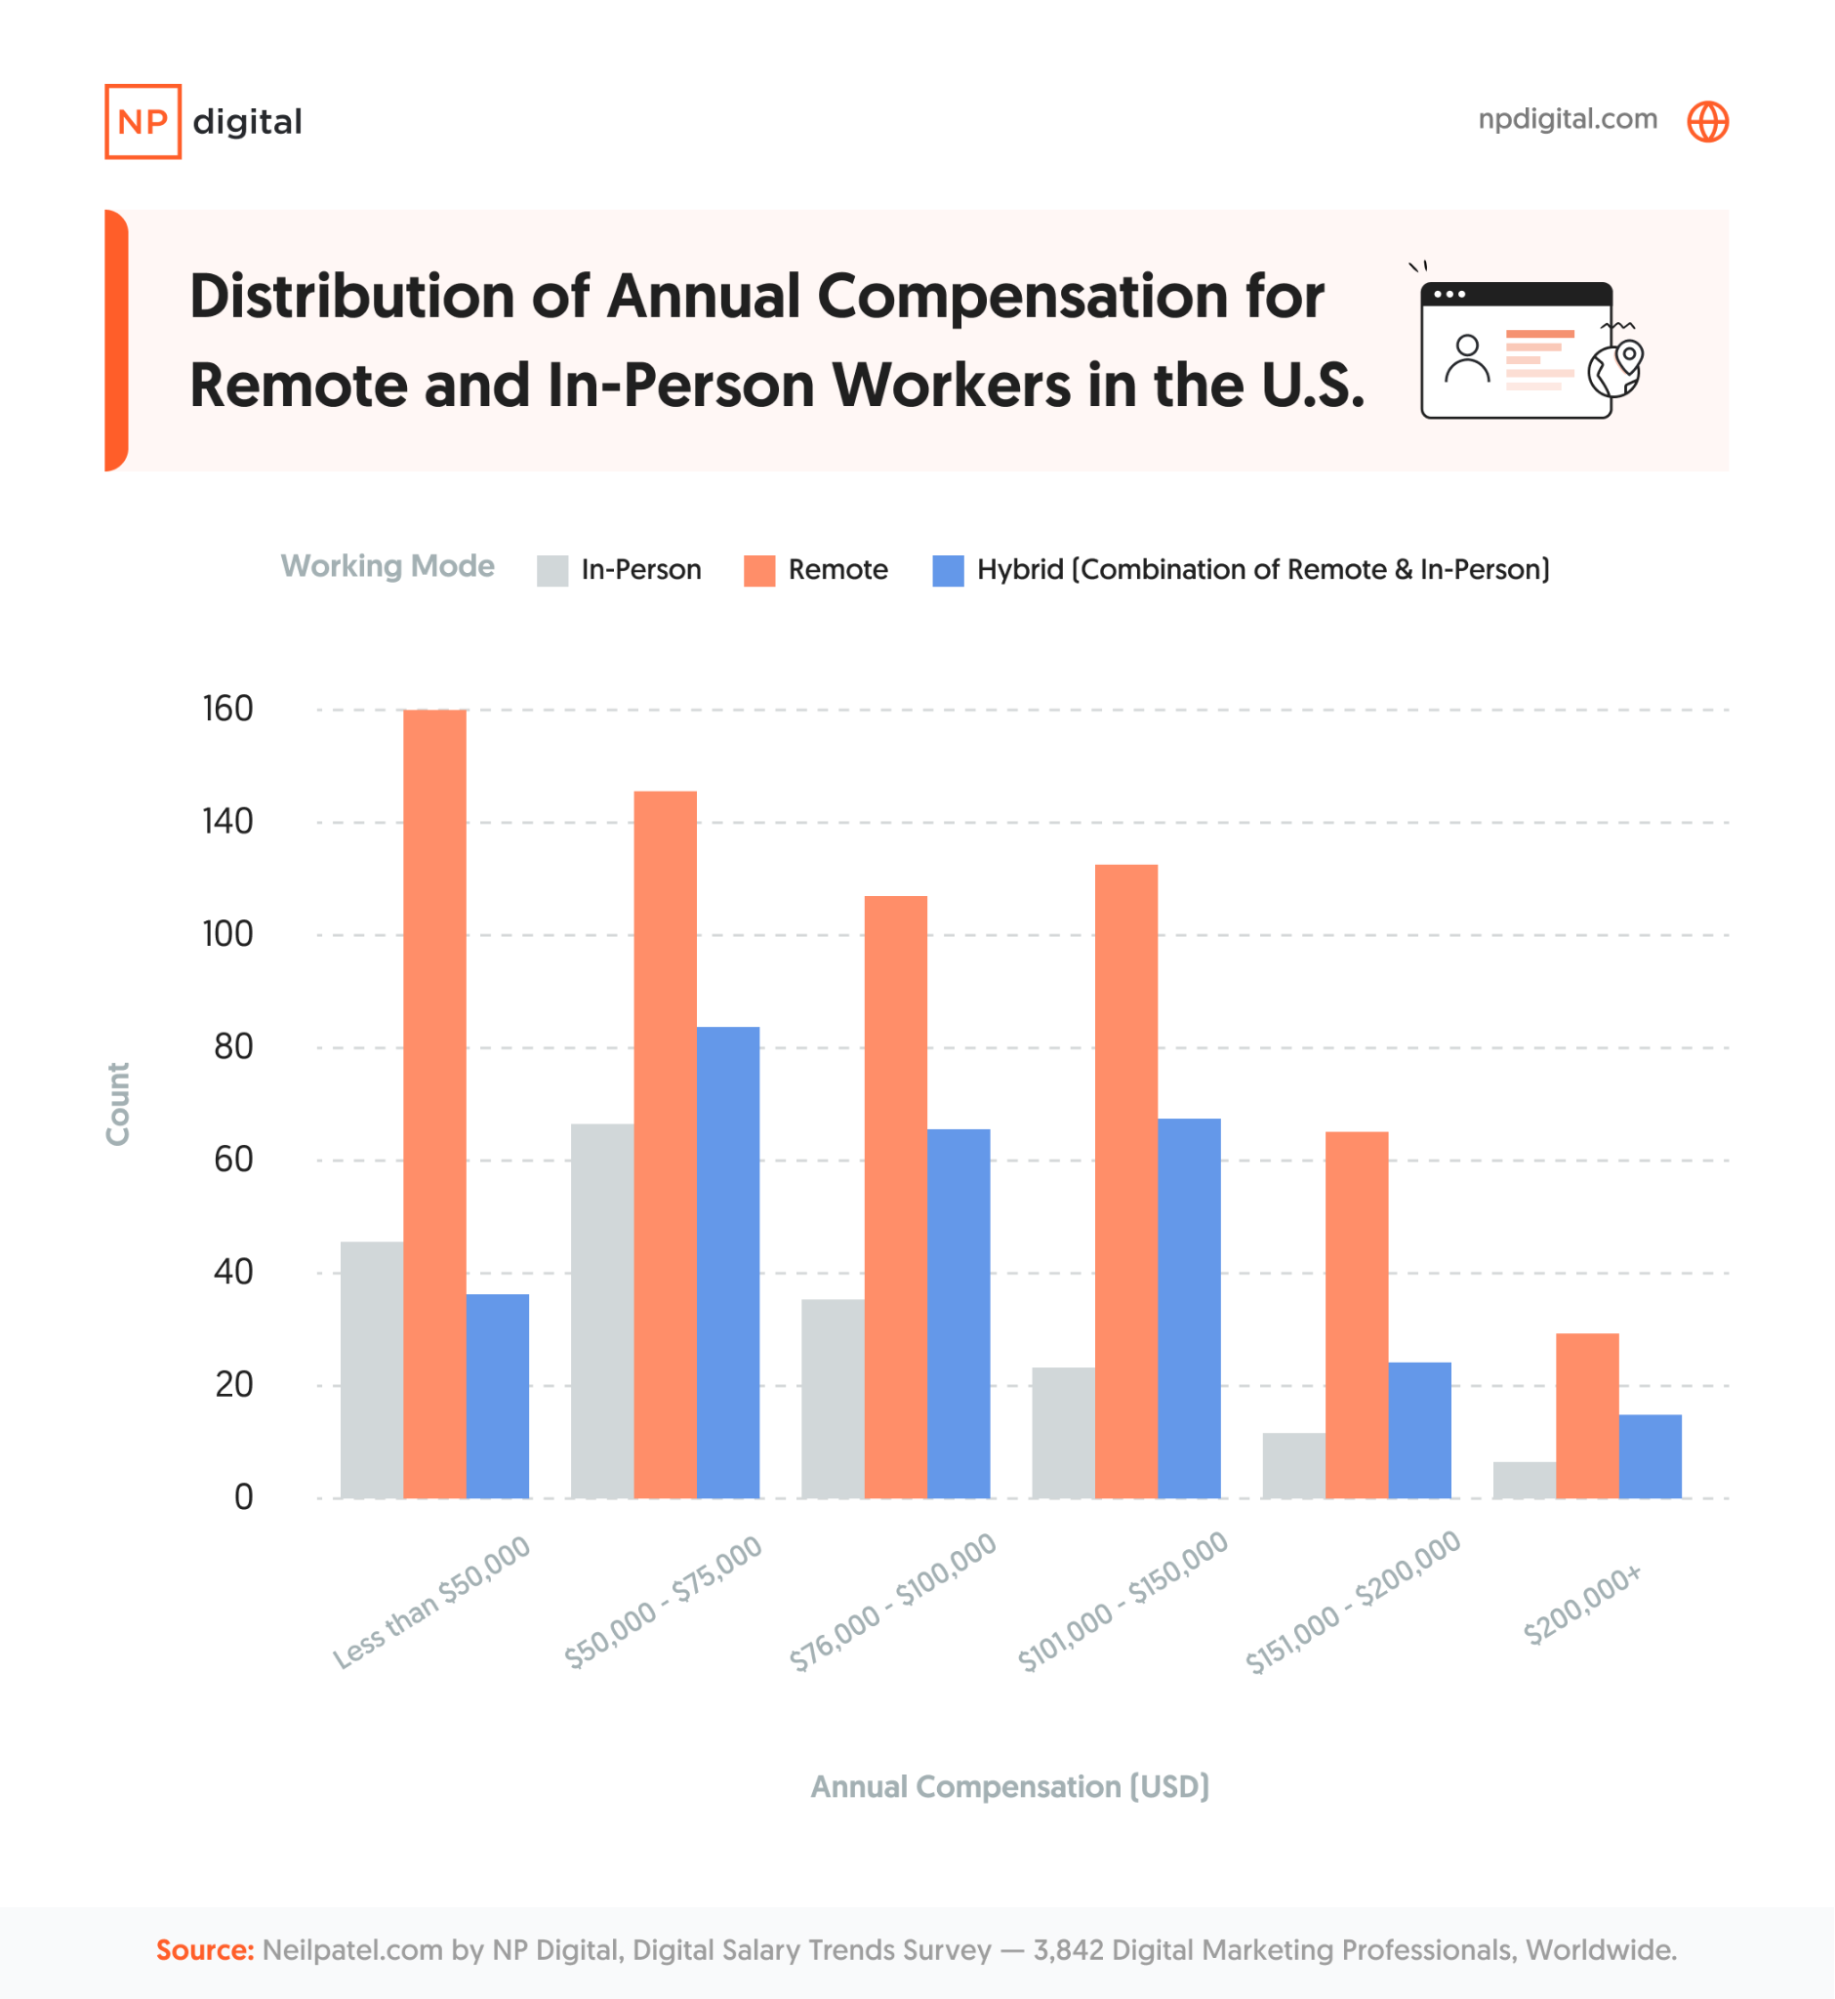
While remote work was more popular overall with U.S. workers, the largest percentage of remote workers were the extremes: less than $75,000 and more than $151,000. In the middle-earning categories, the split between remote and in-person was closer.
This tells us a few items of note. First, remote work is clearly here to stay, and the nature of digital marketing means that remote working options can be available to all roles within a company hierarchy.
Job Category
Digital marketing is not a monolith. Whether you’re working at an agency or on an in-house team, there are several different roles—from SEO and digital PR to logistical roles like those in management and client services. So, are certain job roles better compensated than others? Let’s take a look.
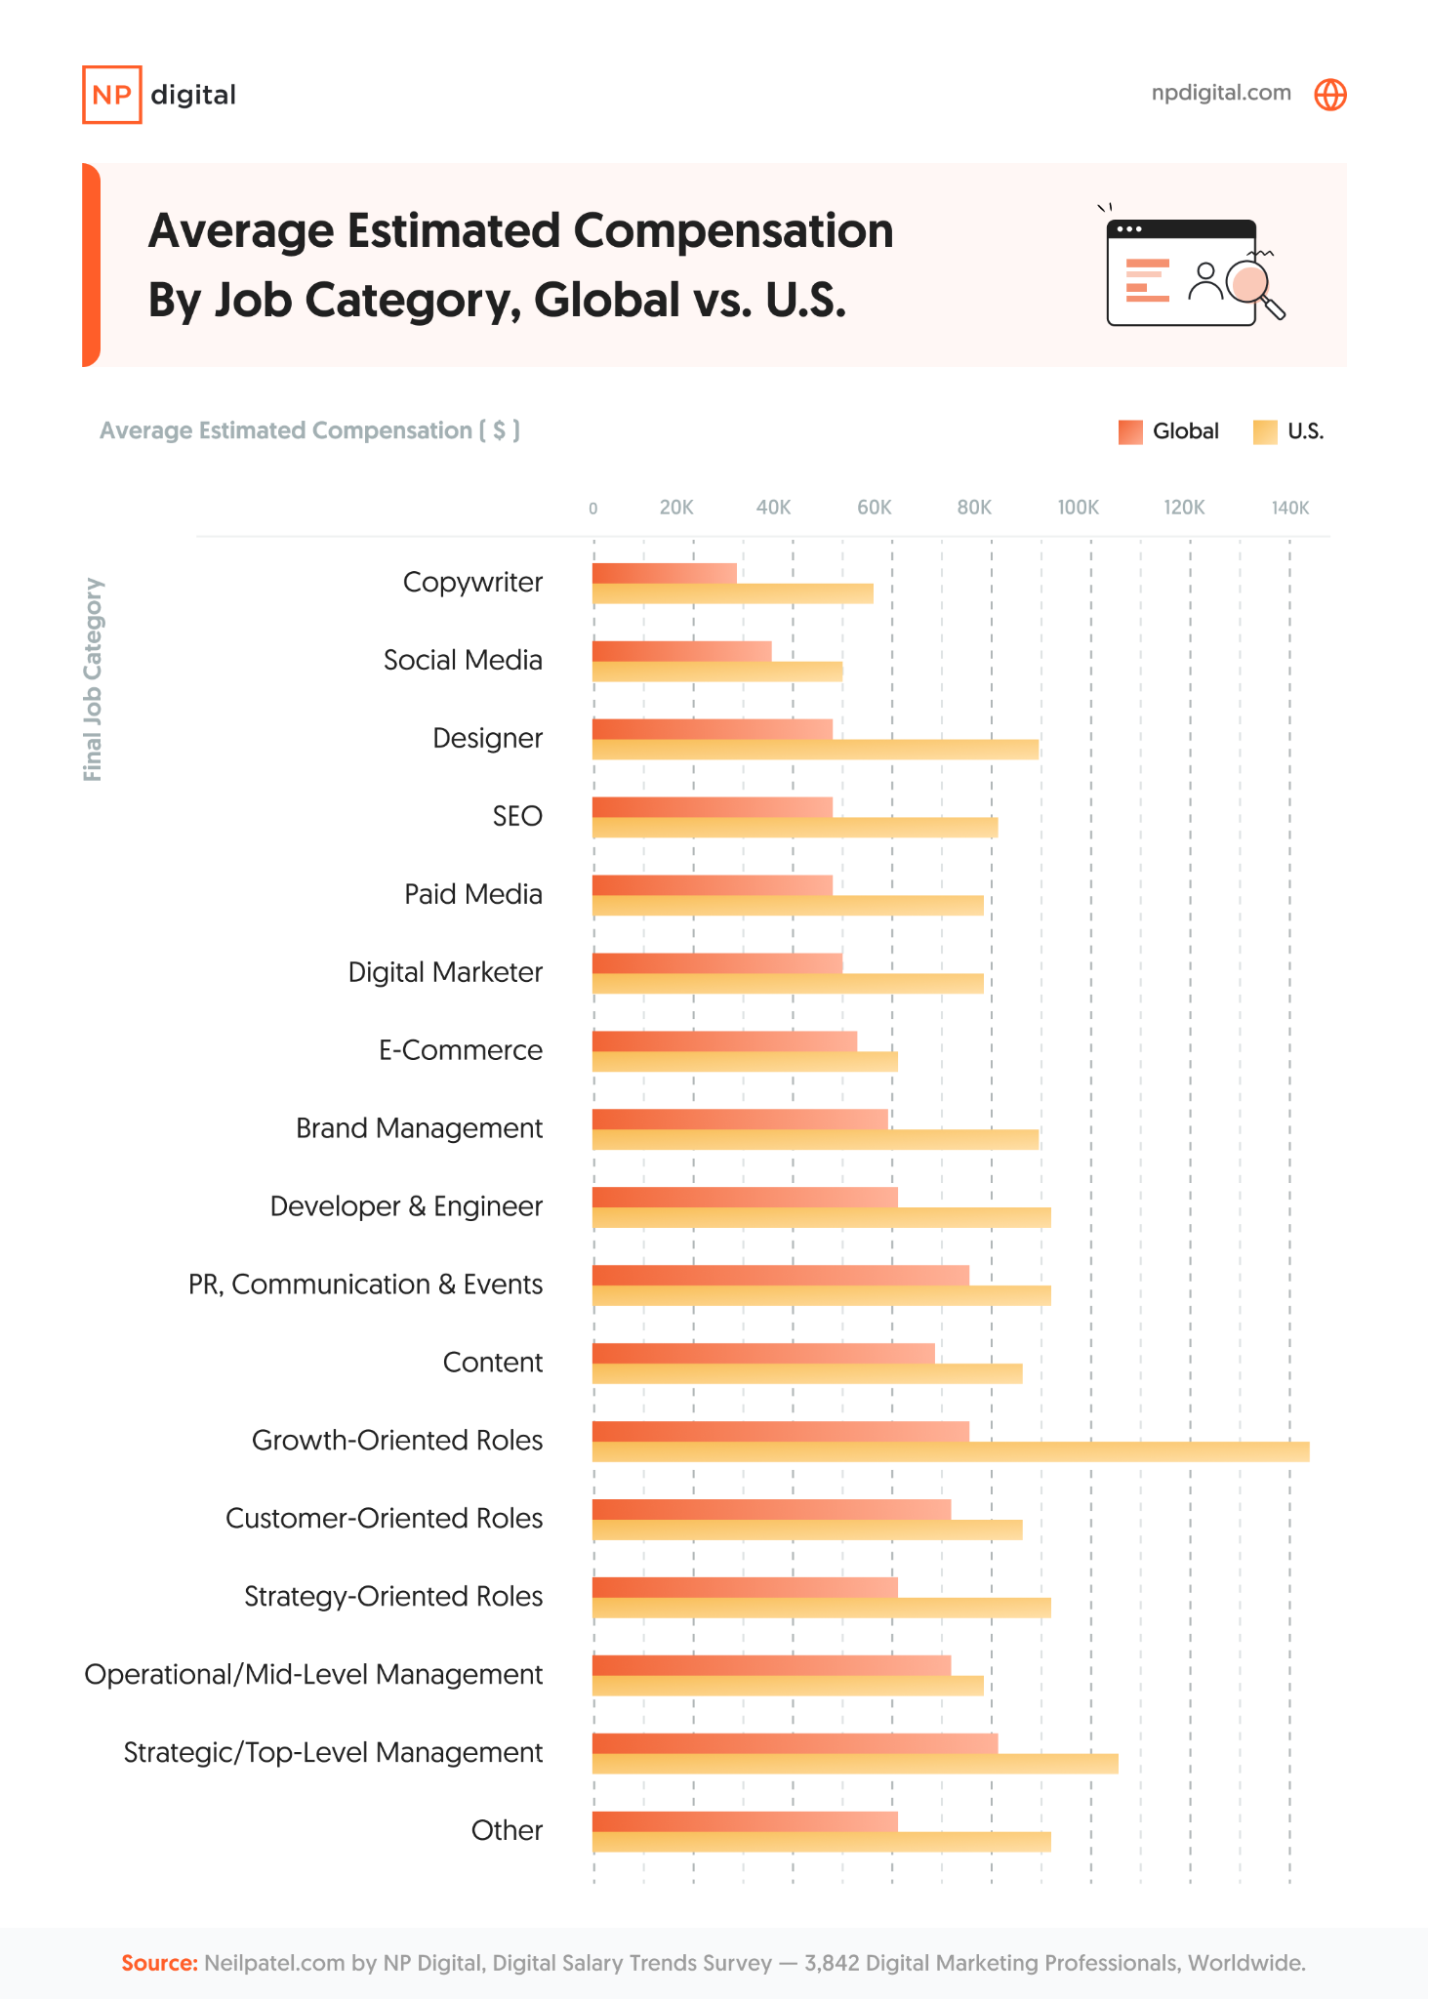
Looking at the chart above, we see quite a few outliers in terms of overall compensation.
The three top-earning categories are:
- Growth-oriented roles (includes individuals who described themselves as “growth marketers” with four or more responsibilities)
- Strategic/top-level management
- Strategy-oriented roles
Not only are these more highly valued within the U.S., but there’s a large compensation gap between them. This also applies globally, especially for growth-oriented roles. There could be a higher value here because these roles require a more specialized skillset, raising compensation. Some positions like growth-oriented roles may demand higher salaries due to the perception of better ROI. In addition, it’s not feasible to outsource some of these roles compared with other roles. By comparison, the bottom roles are, on average:
- E-commerce
- Social media
- Copywriter
One key thing to note about these roles is that average compensation was a lot closer between the U.S. and the rest of the world. This suggests a more standardized perception of the value of these roles across all markets. In addition, the degree to which the U.S. values remote work could also indicate that the talent pool is a lot wider for these roles, driving the overall compensation costs down. It might be a seller’s market for some of these jobs.
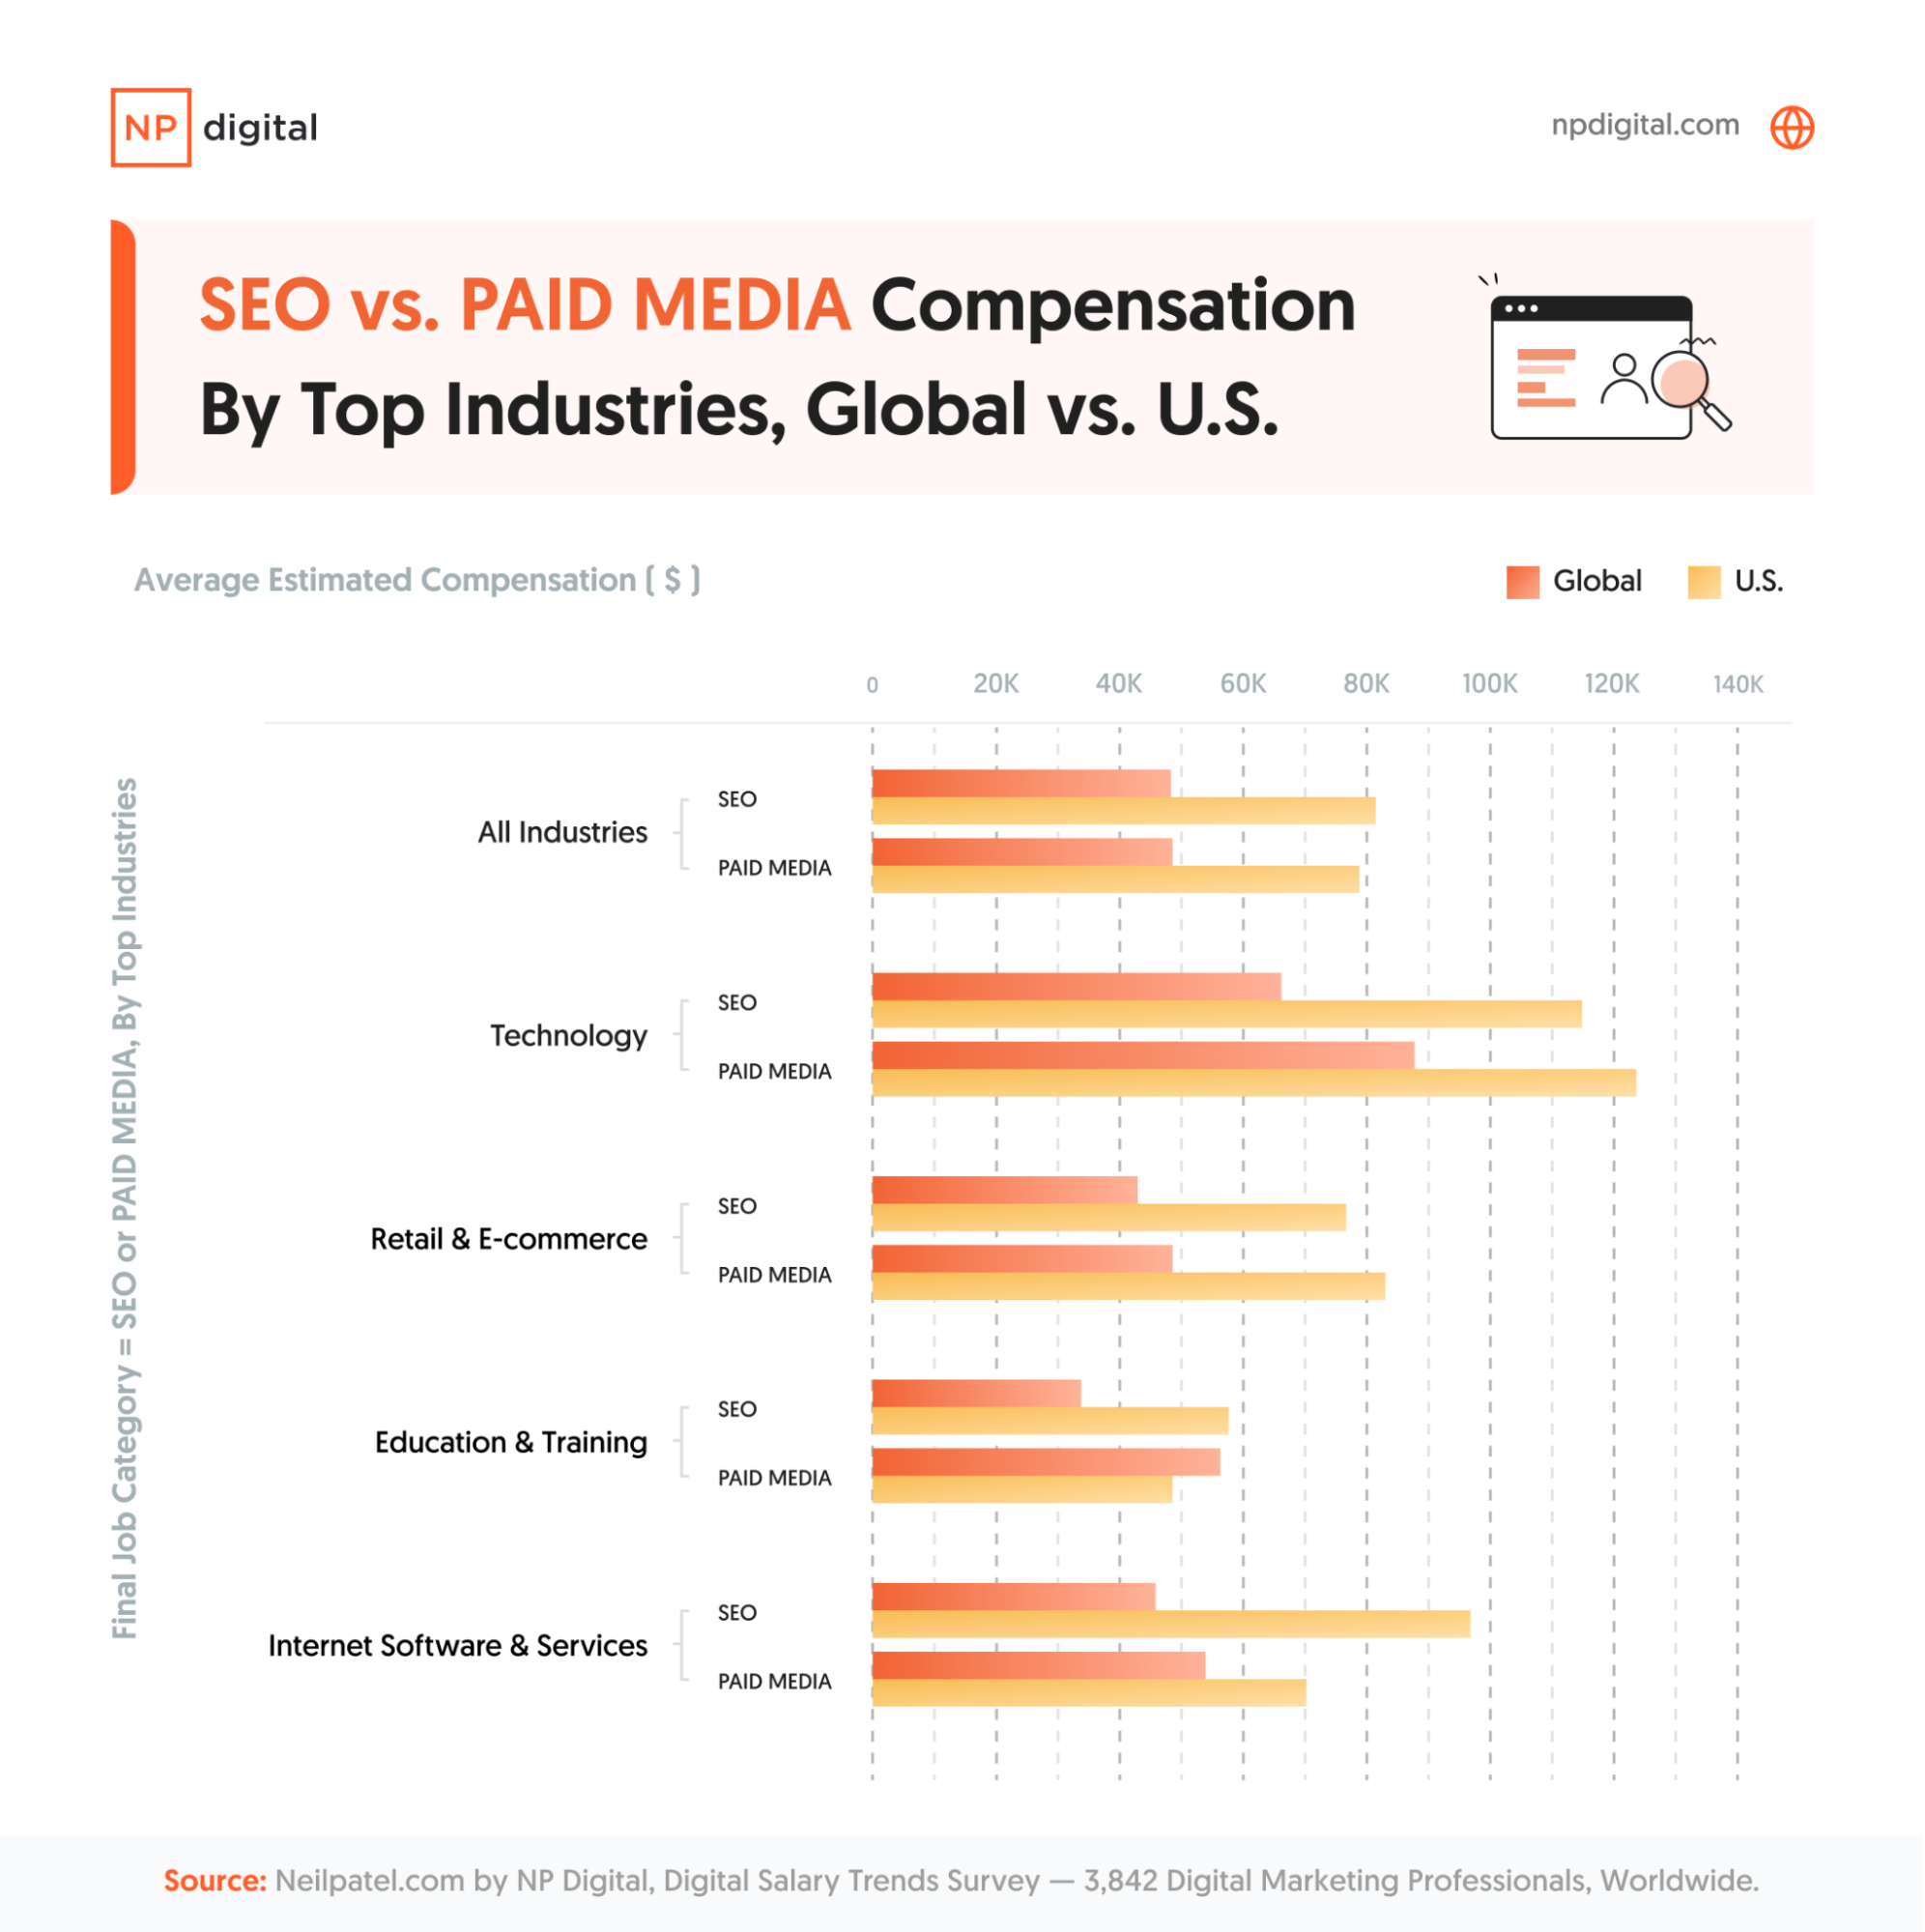
SEO vs. Paid Compensation
Because SEO and paid media are such critical aspects of any program, let’s go a bit deeper. Specifically, when we look at some of the top industries using both marketing tactics, what are people making?
Gender
The gender pay gap is a hot-button topic in digital marketing. When it comes to outside factors impacting compensation, gender often comes to mind. Our findings in the U.S. suggest the industry still has a lot of work to do.
When it comes to gender distribution among our survey respondents, things are largely skewed toward women:
- 57.3 percent female
- 40.6 percent male
- 1.05 percent non-binary
- 1.05 percent prefer not to say
The chart below compares the average compensation of male and female respondents by role rather than years of experience, both in the U.S. and globally. We’ve processed the data as follows:
- Entry-level: This may include responses with keywords like “intern,” “junior,” or other indicators of early-career roles.
- Mid-level: Might encompass keywords such as “manager,” “lead,” or other mid-career indicators.
- Senior-level: This could involve keywords like “senior,” “principal,” or other indicators of higher-ranking non-executive roles.
- Executive: Likely includes keywords like “C-level,” “chief,” “director,” “VP,” or other indicators of executive leadership.
- Others: Everything not categorized by the definitions above
In the U.S., the trend is clear: Men consistently earn more across every seniority level, though things are closer at the entry-level.
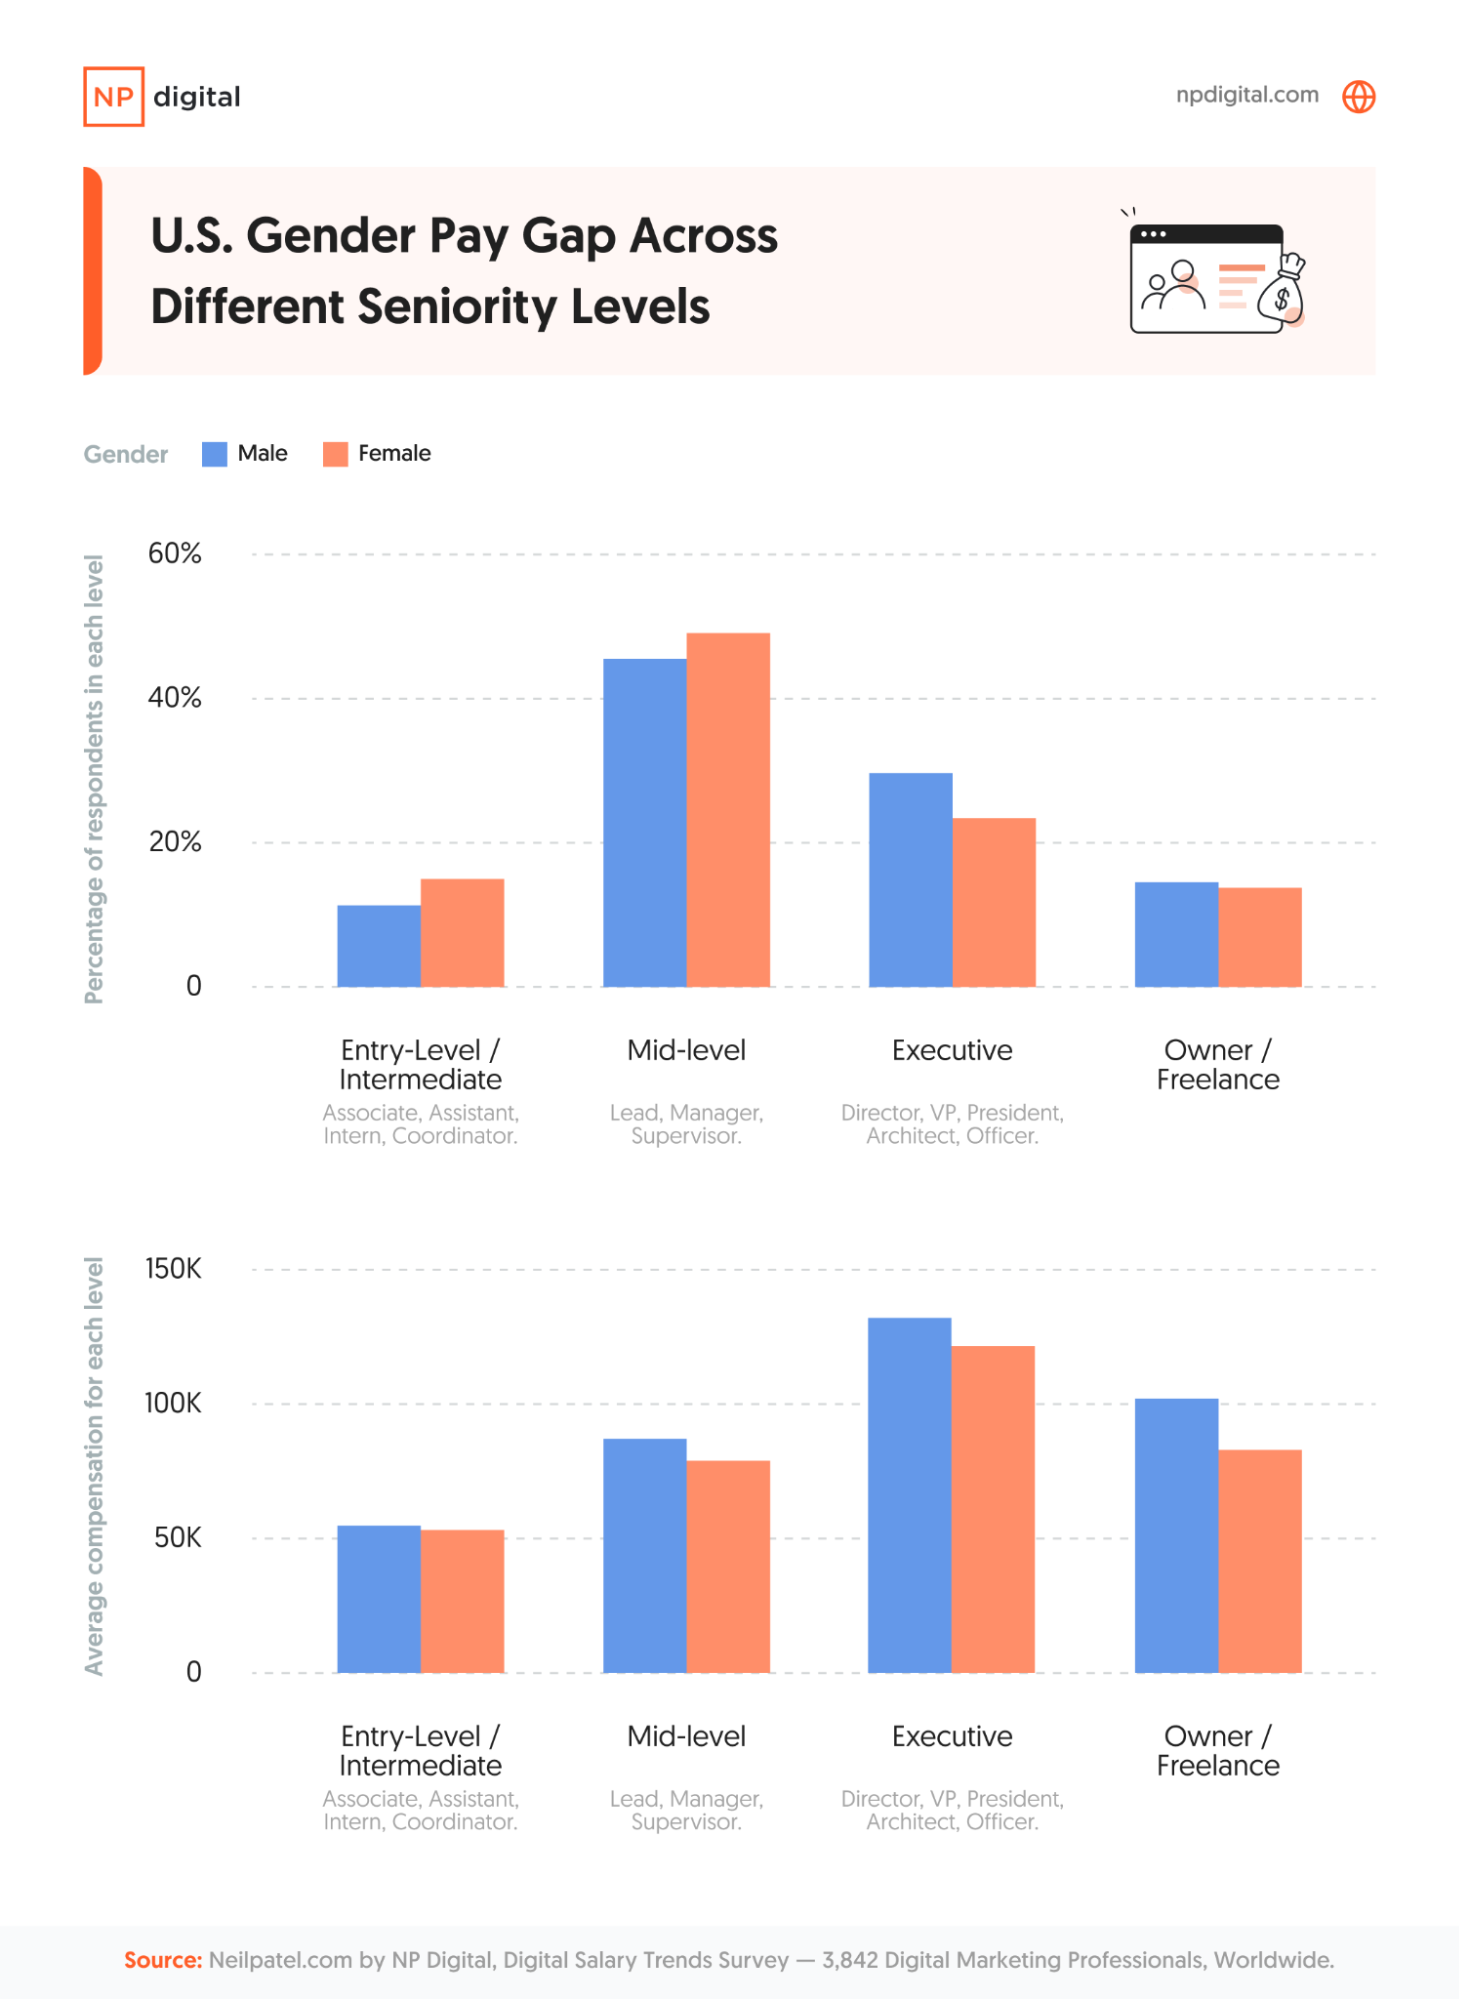
While this paints a picture of disparity, let’s take a look and see if the type of digital marketing role in the U.S. has an impact.
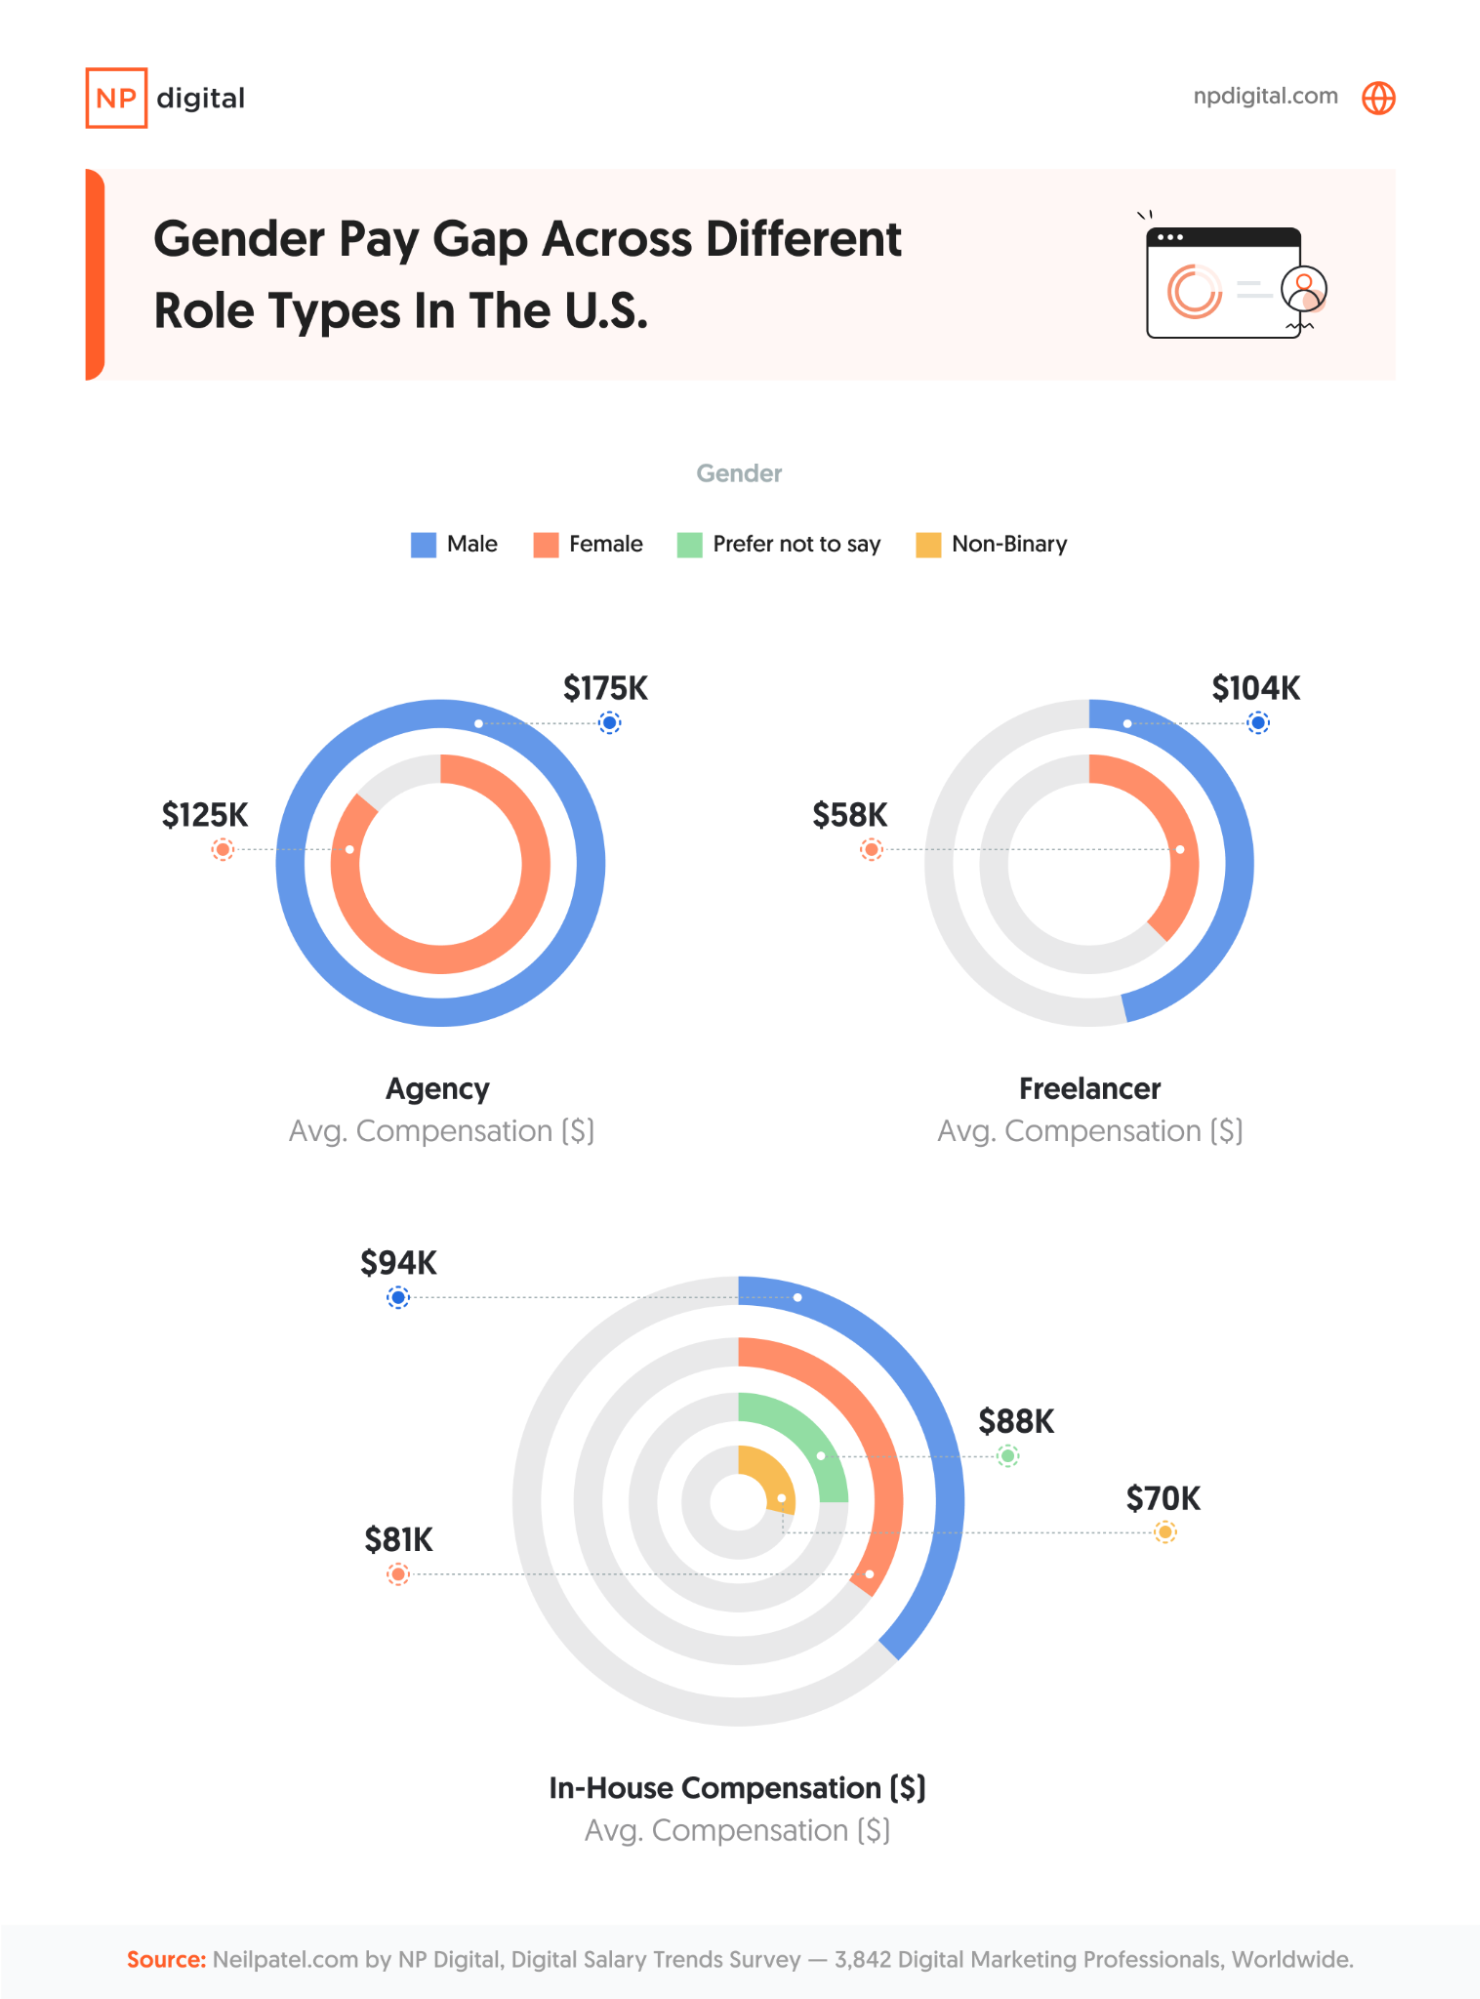
Here are the average salaries for each category across each role:
Agency
- Female: $125,500
- Male: $175,500
Freelancer
- Female: $58,000
- Male: $104,000
In-house
- Female: $81,868
- Male: $94,614
- Non-binary: $70,773
- Prefer not to say: $88,917
One thing to note here is the gender pay gap was present in all categories and roles, but it was most pronounced in the freelance world and saw the best parity among in-house roles. This might be because companies with their own in-house teams have a greater focus and concern on providing equal pay for all positions, regardless of gender.
How Is Global Digital Marketing Compensation Impacted By Outside Factors?
The U.S. may be a prominent market for the digital marketing world, but it’s far from the only game in town. When we include data from the rest of the globe, it paints an interesting picture. To start, let’s look at some of the factors that influence compensation in the digital marketing industry on a global scale.
Experience
Similar to our U.S.-focused data, assuming a basic correlation between experience and salary doesn’t tell the whole story.
As you might expect, higher compensation is more common among those with more experience.
However, many survey respondents, regardless of experience level, reported they earned less than $50,000 annually. While this is most often the case for digital marketers with less than two years of experience, it also applies to many with substantially more experience, too.
Why is this the case? Some reasons are that some digital marketers may work in lower-paying industries like the nonprofit sector or do part-time digital marketing along with their primary job.
Those in the mid-experience range (i.e., four to five years and six to seven years) are more evenly distributed across various compensation levels. This suggests that other factors may play a role in compensation, not just years in the industry.
Location
Digital marketing salaries vary greatly across the world, with some countries offering greater financial compensation than others.
To recap, the U.S. was the leader in terms of compensation overall but has a wide span of compensation brackets represented. In countries like India and Brazil, the majority of respondents earn less than $50,000.
Interestingly, in the United Kingdom, often seen as one of the heavy hitters in digital marketing, there’s a relatively even spread across the $51,000-to-$75,000 and less-than-$50,000 brackets.
Why is this data so important? When building a business in a specific country, it’s essential to know how much it will cost to create a digital marketing team. If you’re on a tight budget, you may choose to outsource from countries with lower average salaries.
Education
If you want to pursue a career in digital marketing, should you go to college or go straight into the industry to get work experience? And if you do go to college, what level of education should you pursue?
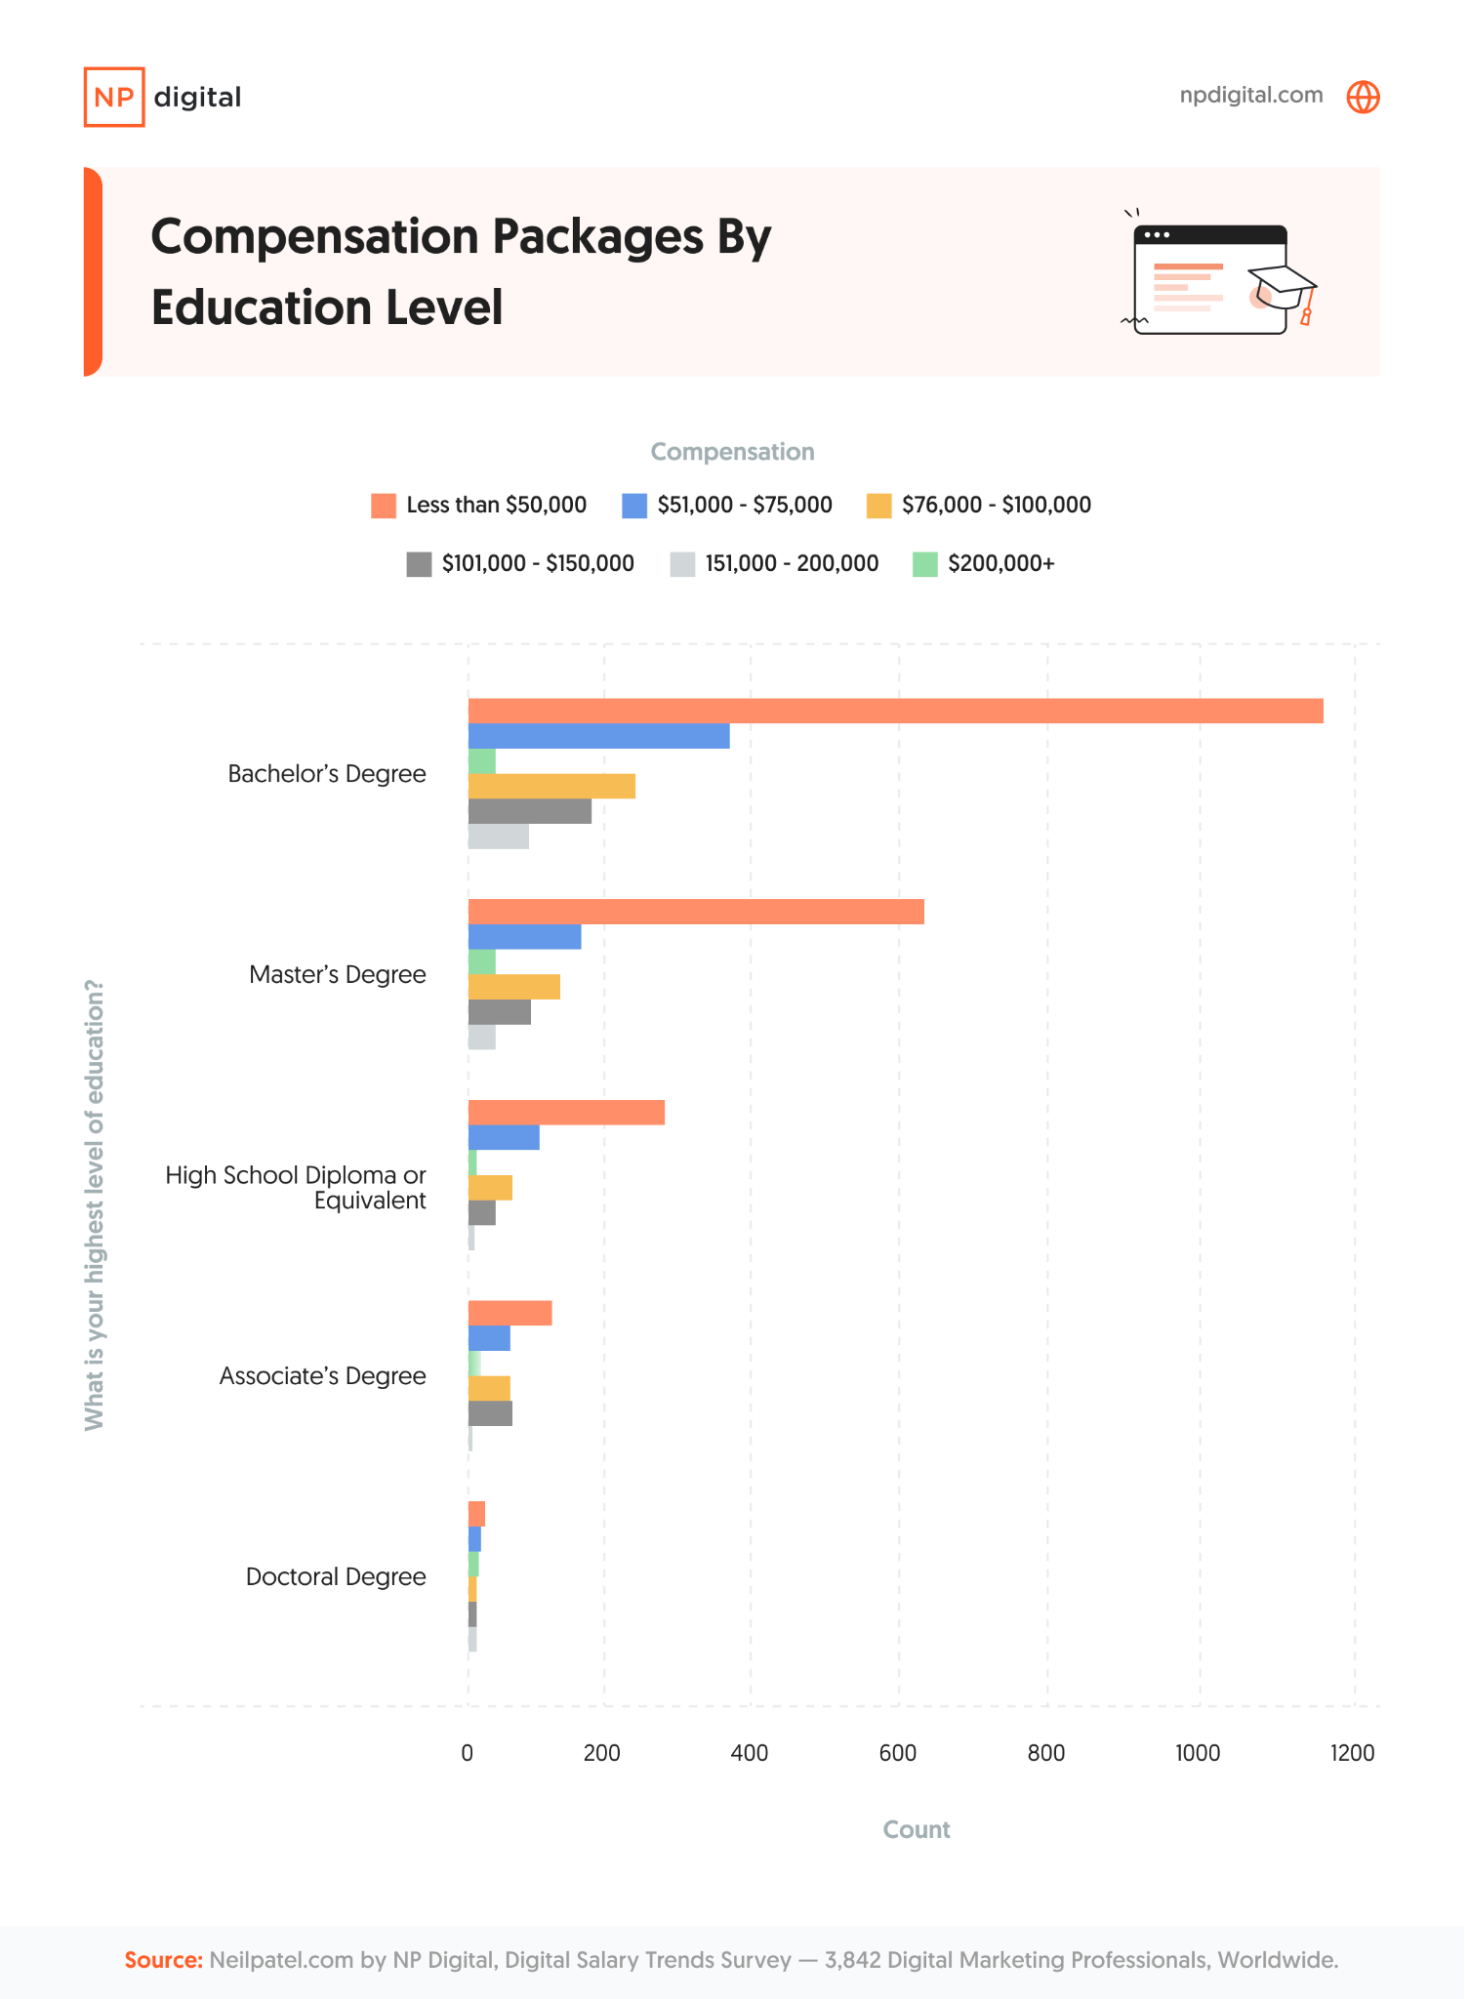
It’s interesting to see that there’s a diminishing return when it comes to education. In some sectors, the pay difference between a bachelor’s degree and a doctorate is surprisingly minimal.
However, as a general rule, those with a college education can expect larger salaries than those without.
We also asked respondents what industry they worked in to see how this correlated to education and compensation. Here are some of the most fascinating findings:
- You’re most likely to earn less than $50,000 if you work agency-side, regardless of education level.
- If you have a doctorate, you’re more likely to see a salary of more than $200,000 if you work in the technology or finance sector.
- Your level of education plays less of a role when it comes to salary in the health, wellness, and fitness industries, as well as in manufacturing.
Age
Digital marketing is an age-inclusive industry, with respondents ranging from younger than 18 to older than 65. The majority of respondents to this survey were 25 to 34.
As an aside, younger cohorts are more gender-inclusive, while older age groups, particularly those 55 and above, are male-dominated.
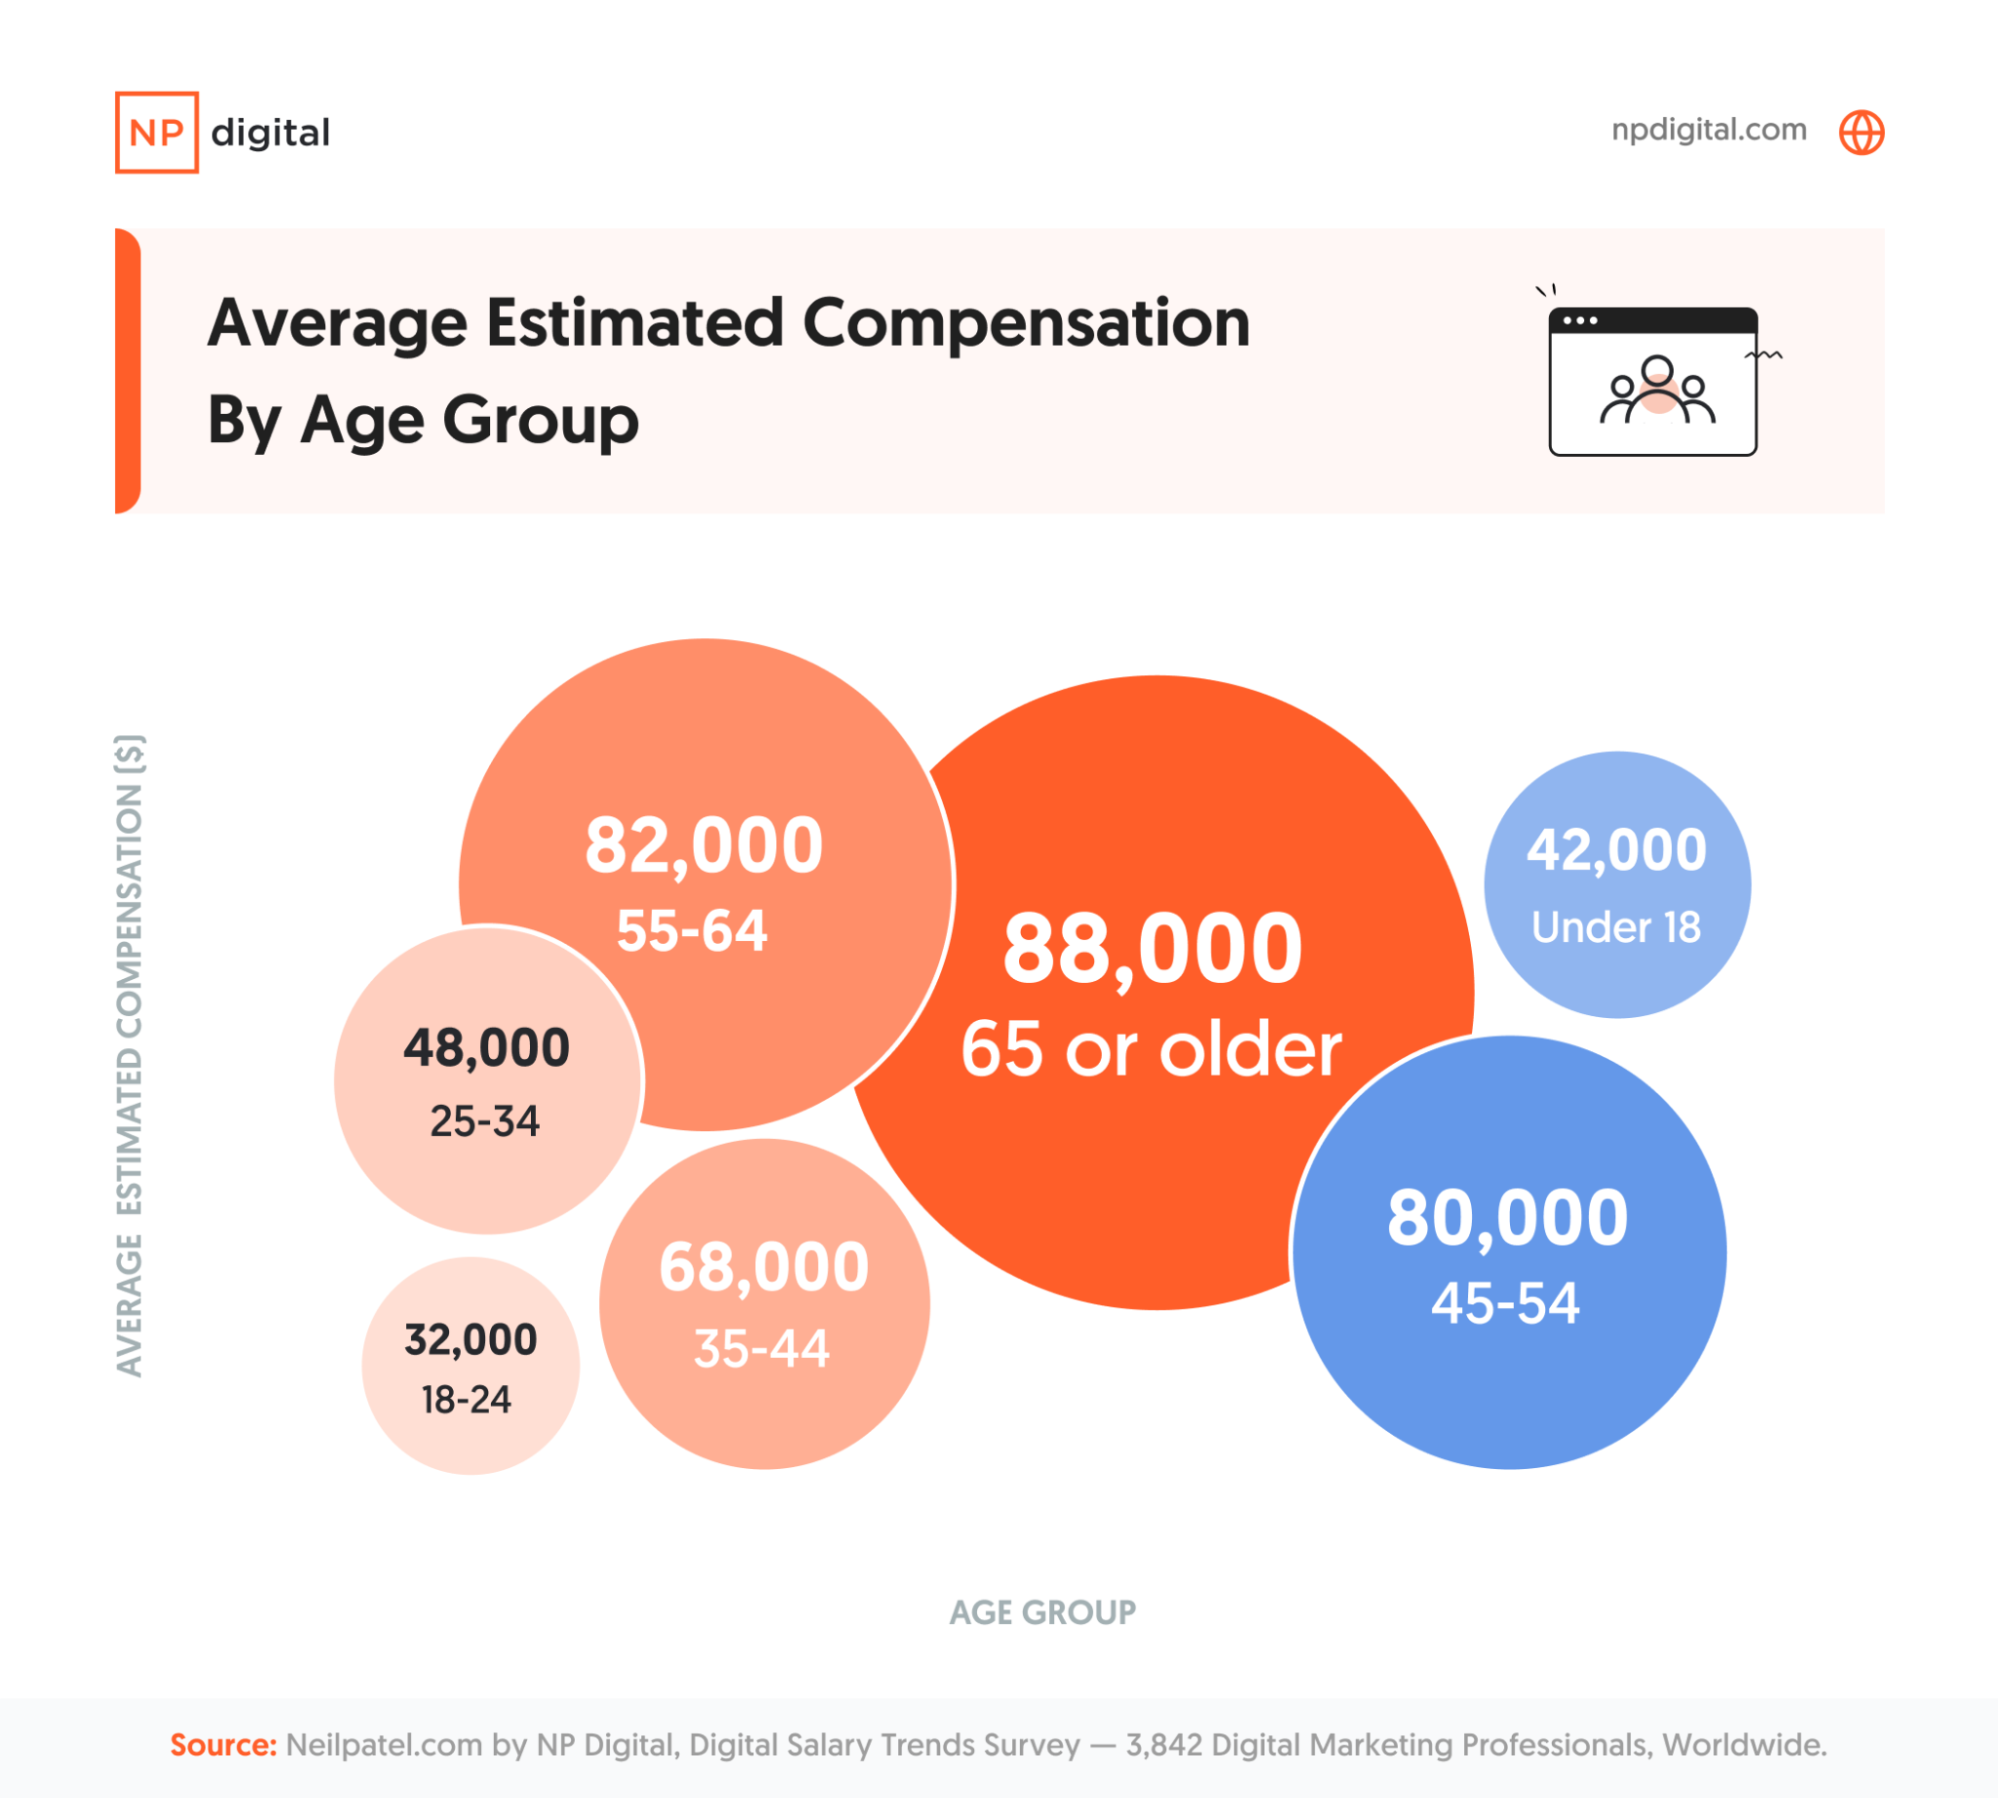
As you might expect, the average digital marketing salary increases by age group, with one interesting outlier: Digital marketers under 18 earn more than those in the 18-to-24 age group.
What’s the reason behind this? Younger digital marketers may be more involved in influencer marketing, which can be a lucrative industry.
However, it’s vital to remember that we received less data for the under-18 age cohort, making it more challenging to draw a definitive conclusion.
Gender
Compared to the U.S. data, we received a near-equal split of responses from men (49.2 percent) and women (49.8 percent). Non-binary people (0.55 percent) and those who preferred not to say (0.45 percent) formed a minor proportion of the total responses.
Again, note that we processed the average compensation of male and female respondents by role rather than years of experience in the U.S. and globally, using this breakdown:
- Entry-level: This may include responses with keywords like “intern,” “junior,” or other indicators of early-career roles.
- Mid-level: Might encompass keywords such as “manager,” “lead,” or other mid-career indicators.
- Senior-level: This could involve keywords like “senior,” “principal,” or other indicators of higher-ranking non-executive roles.
- Executive: Likely includes keywords like “C-level,” “chief,” “director,” “VP,” or other indicators of executive leadership.
- Others: Everything not categorized by the definitions above.
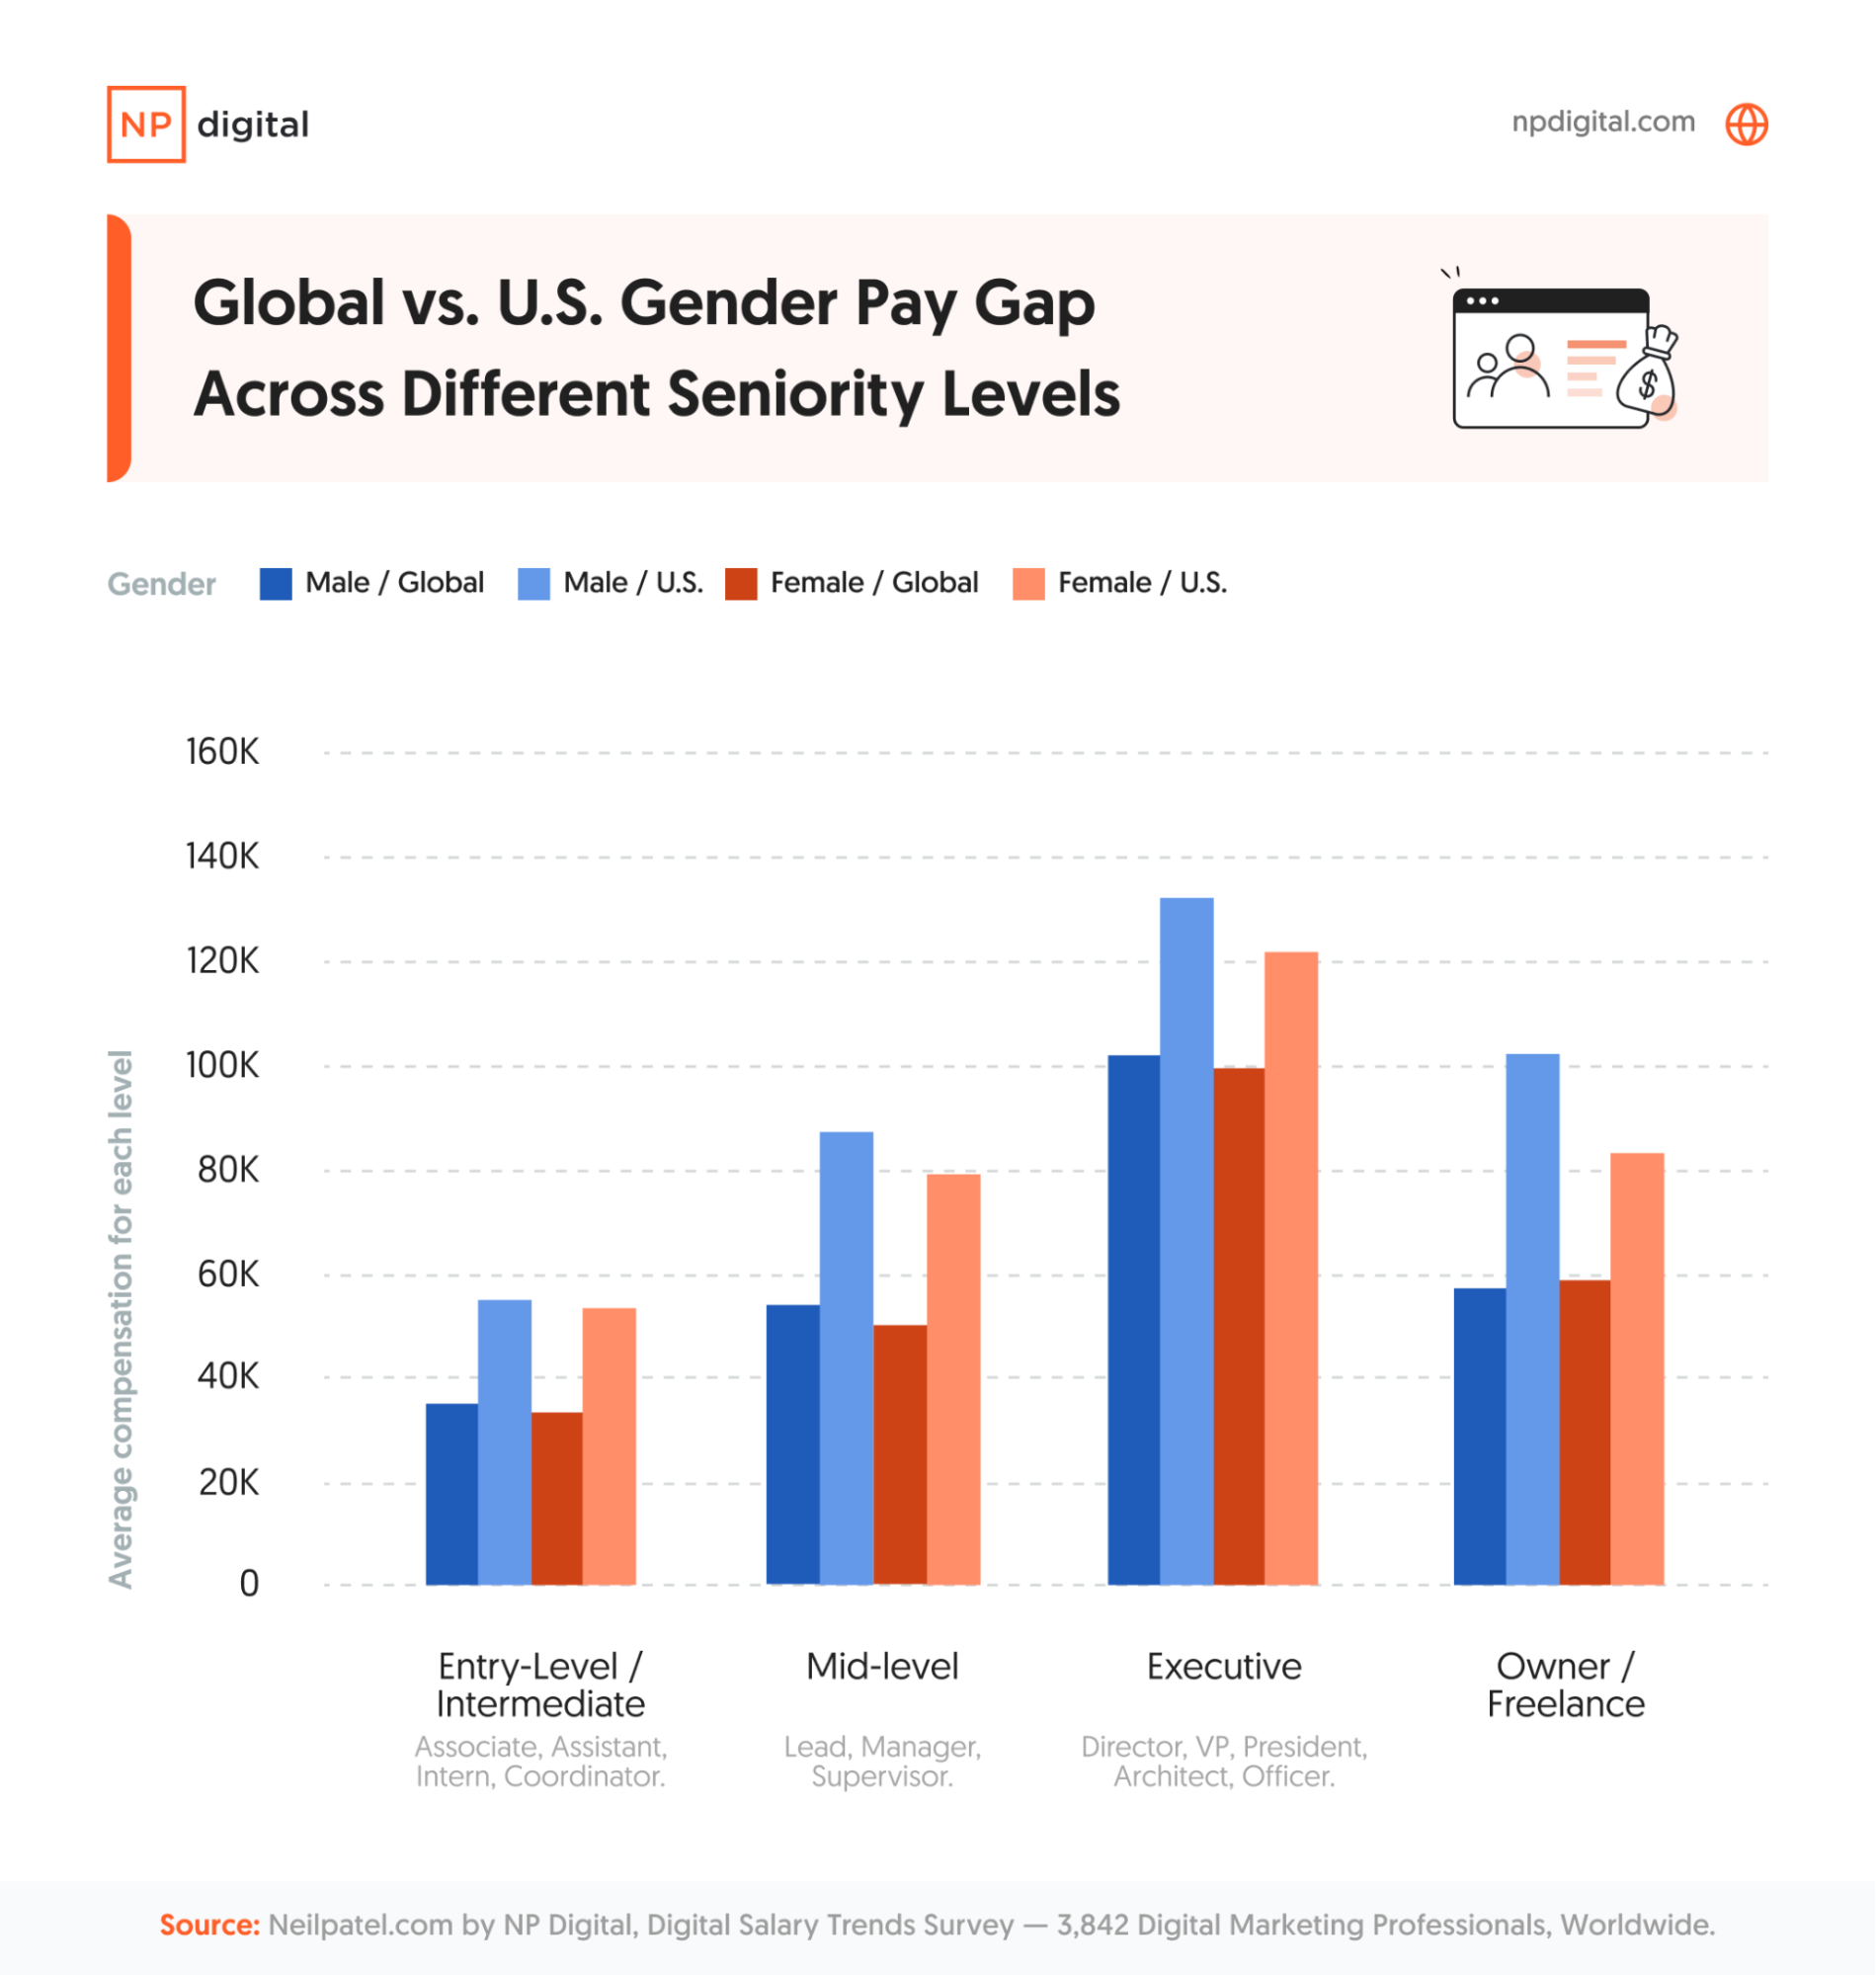
Globally, the earnings gap between men and women was smaller than it was in the U.S. across all levels. Although, men were slightly ahead. One notable finding is that in our survey, women owners/freelancers globally actually earned slightly more than their male counterparts.
Remote Work
Let’s drill down and see how digital marketing salaries compared based on whether a role is in-person, remote, or hybrid (a combination of in-person and remote).
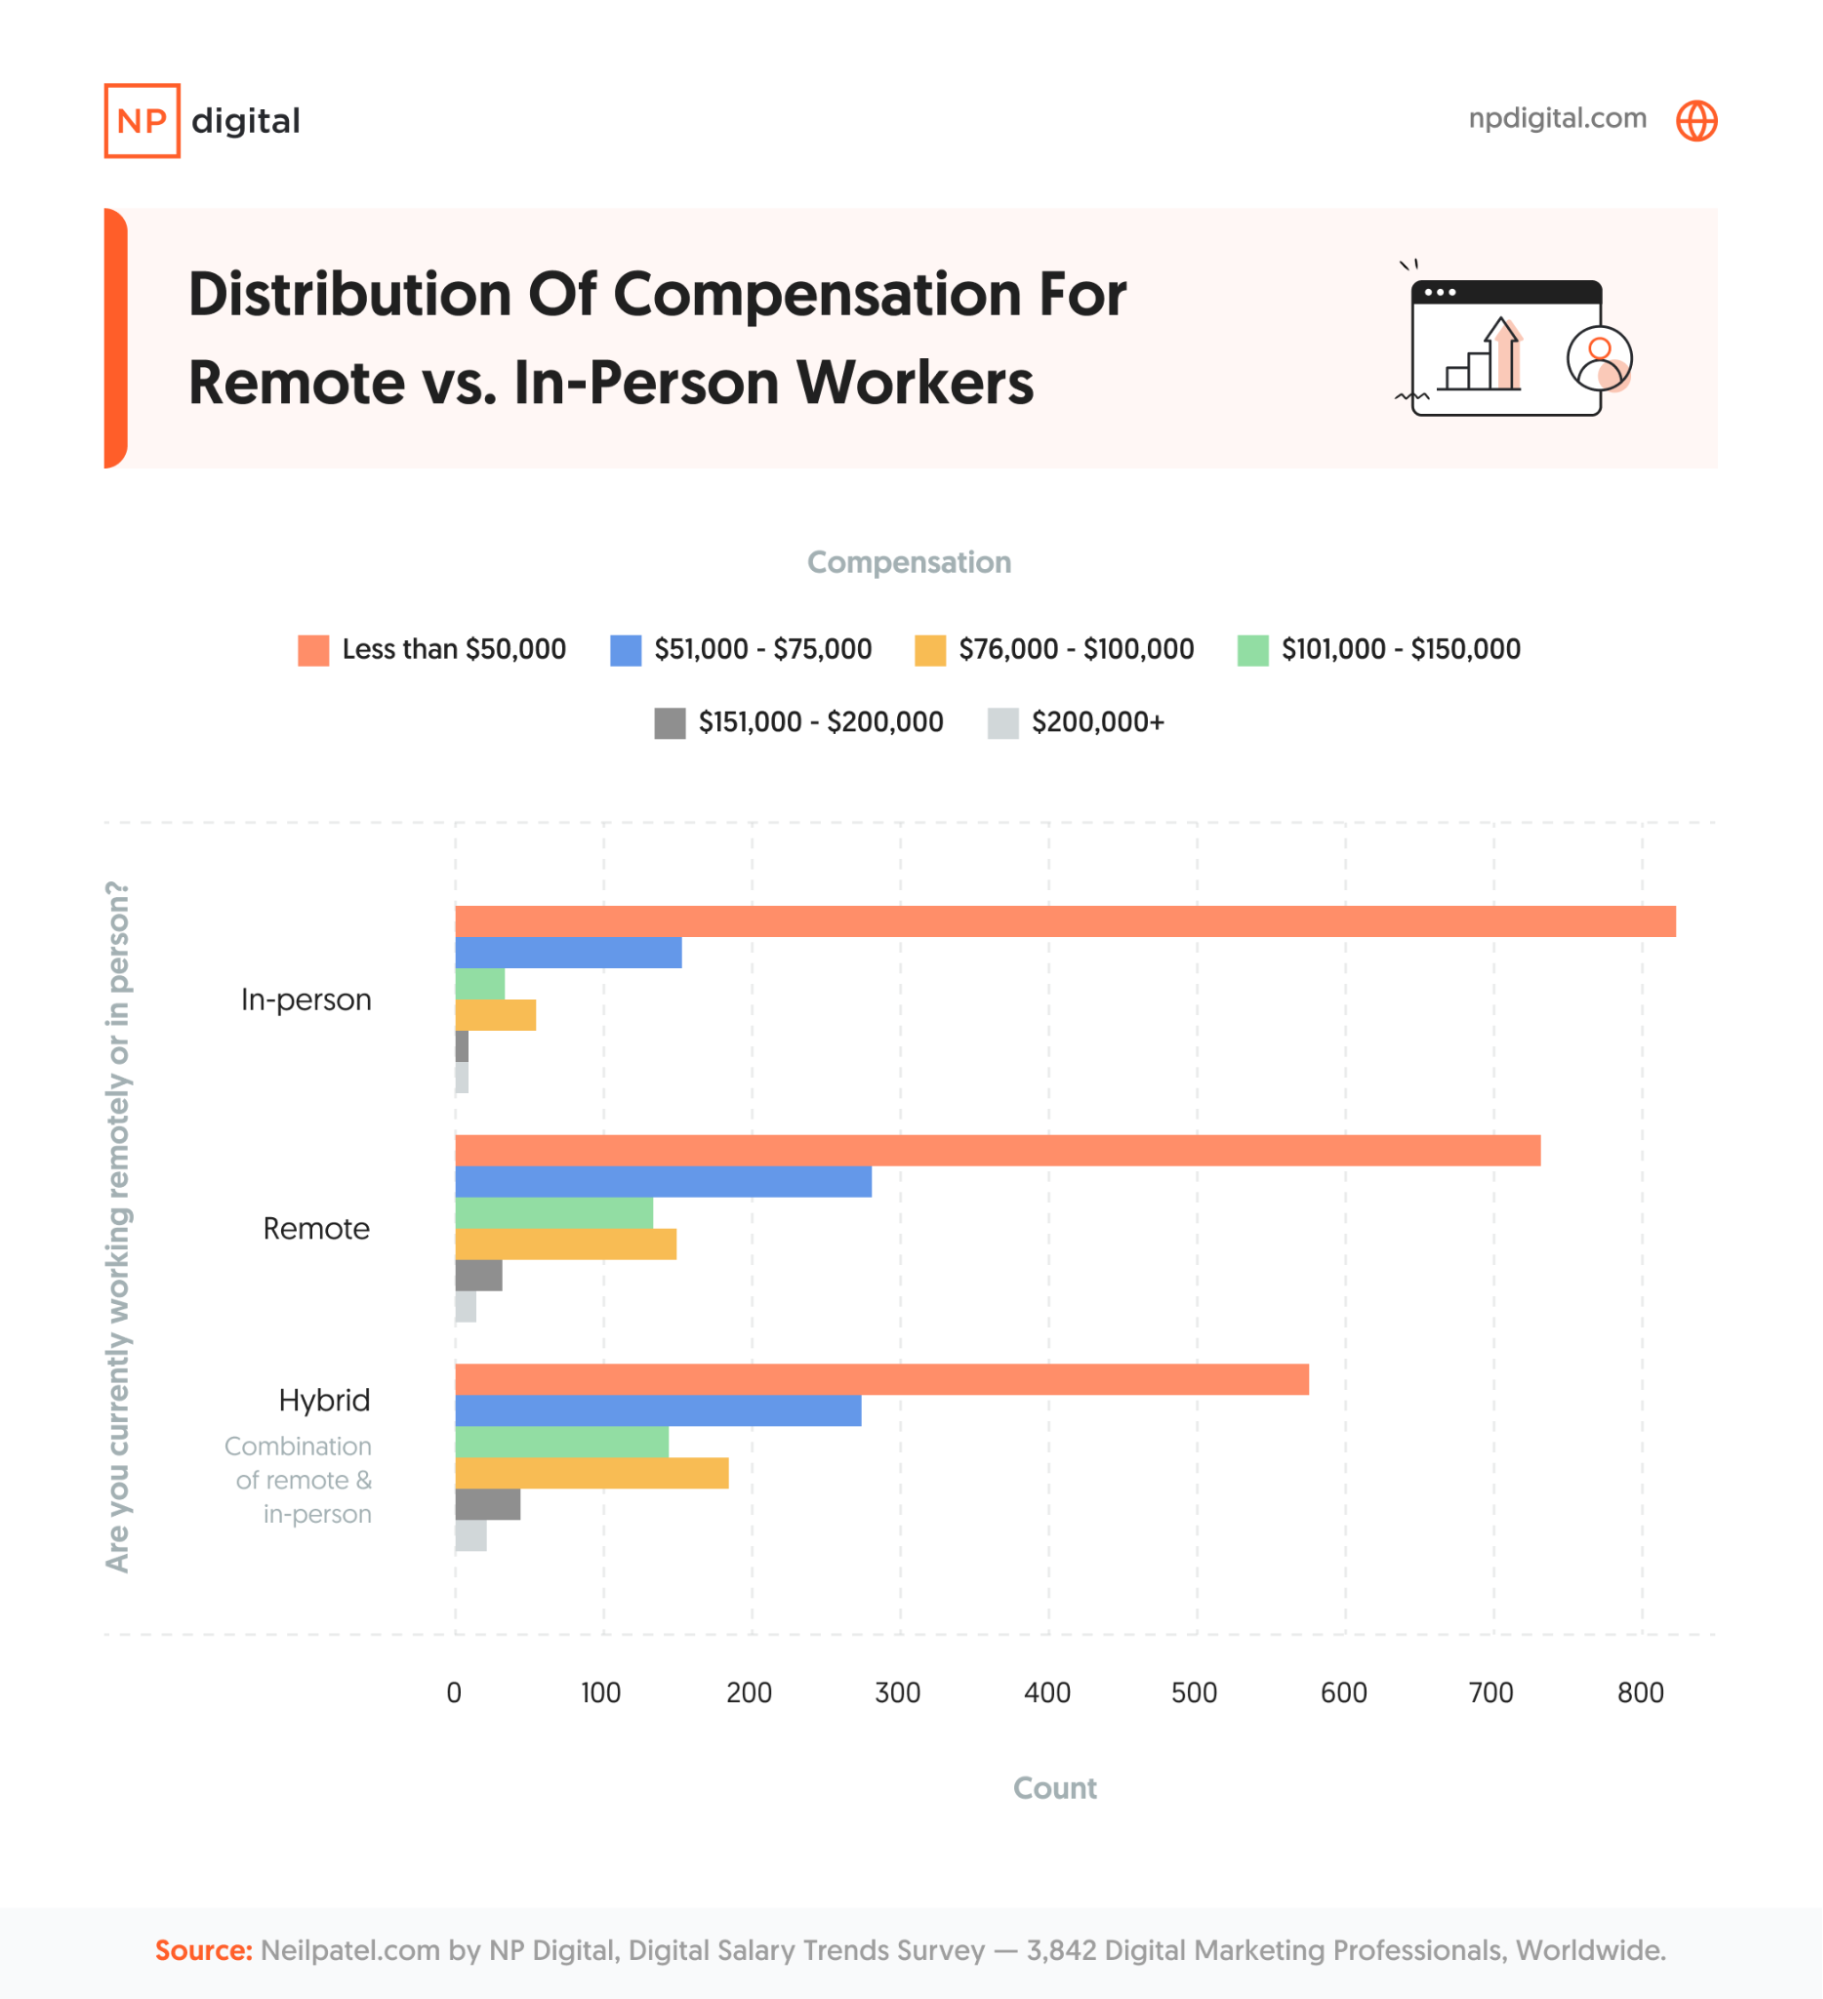
The results of the survey show that working remotely or in-person doesn’t have a drastic effect on compensation.
However, remote workers have a slightly higher representation in the $51,000-to-$75,000 bracket than in-person workers. This could be due to a number of factors, including the types of jobs that have remote capabilities being better compensated as well as higher remote salaries in the U.S.
Company Size
As a rule of thumb, larger businesses have more demands when it comes to marketing, meaning they require more experienced digital marketing employees.
However, does this equate to larger salaries?
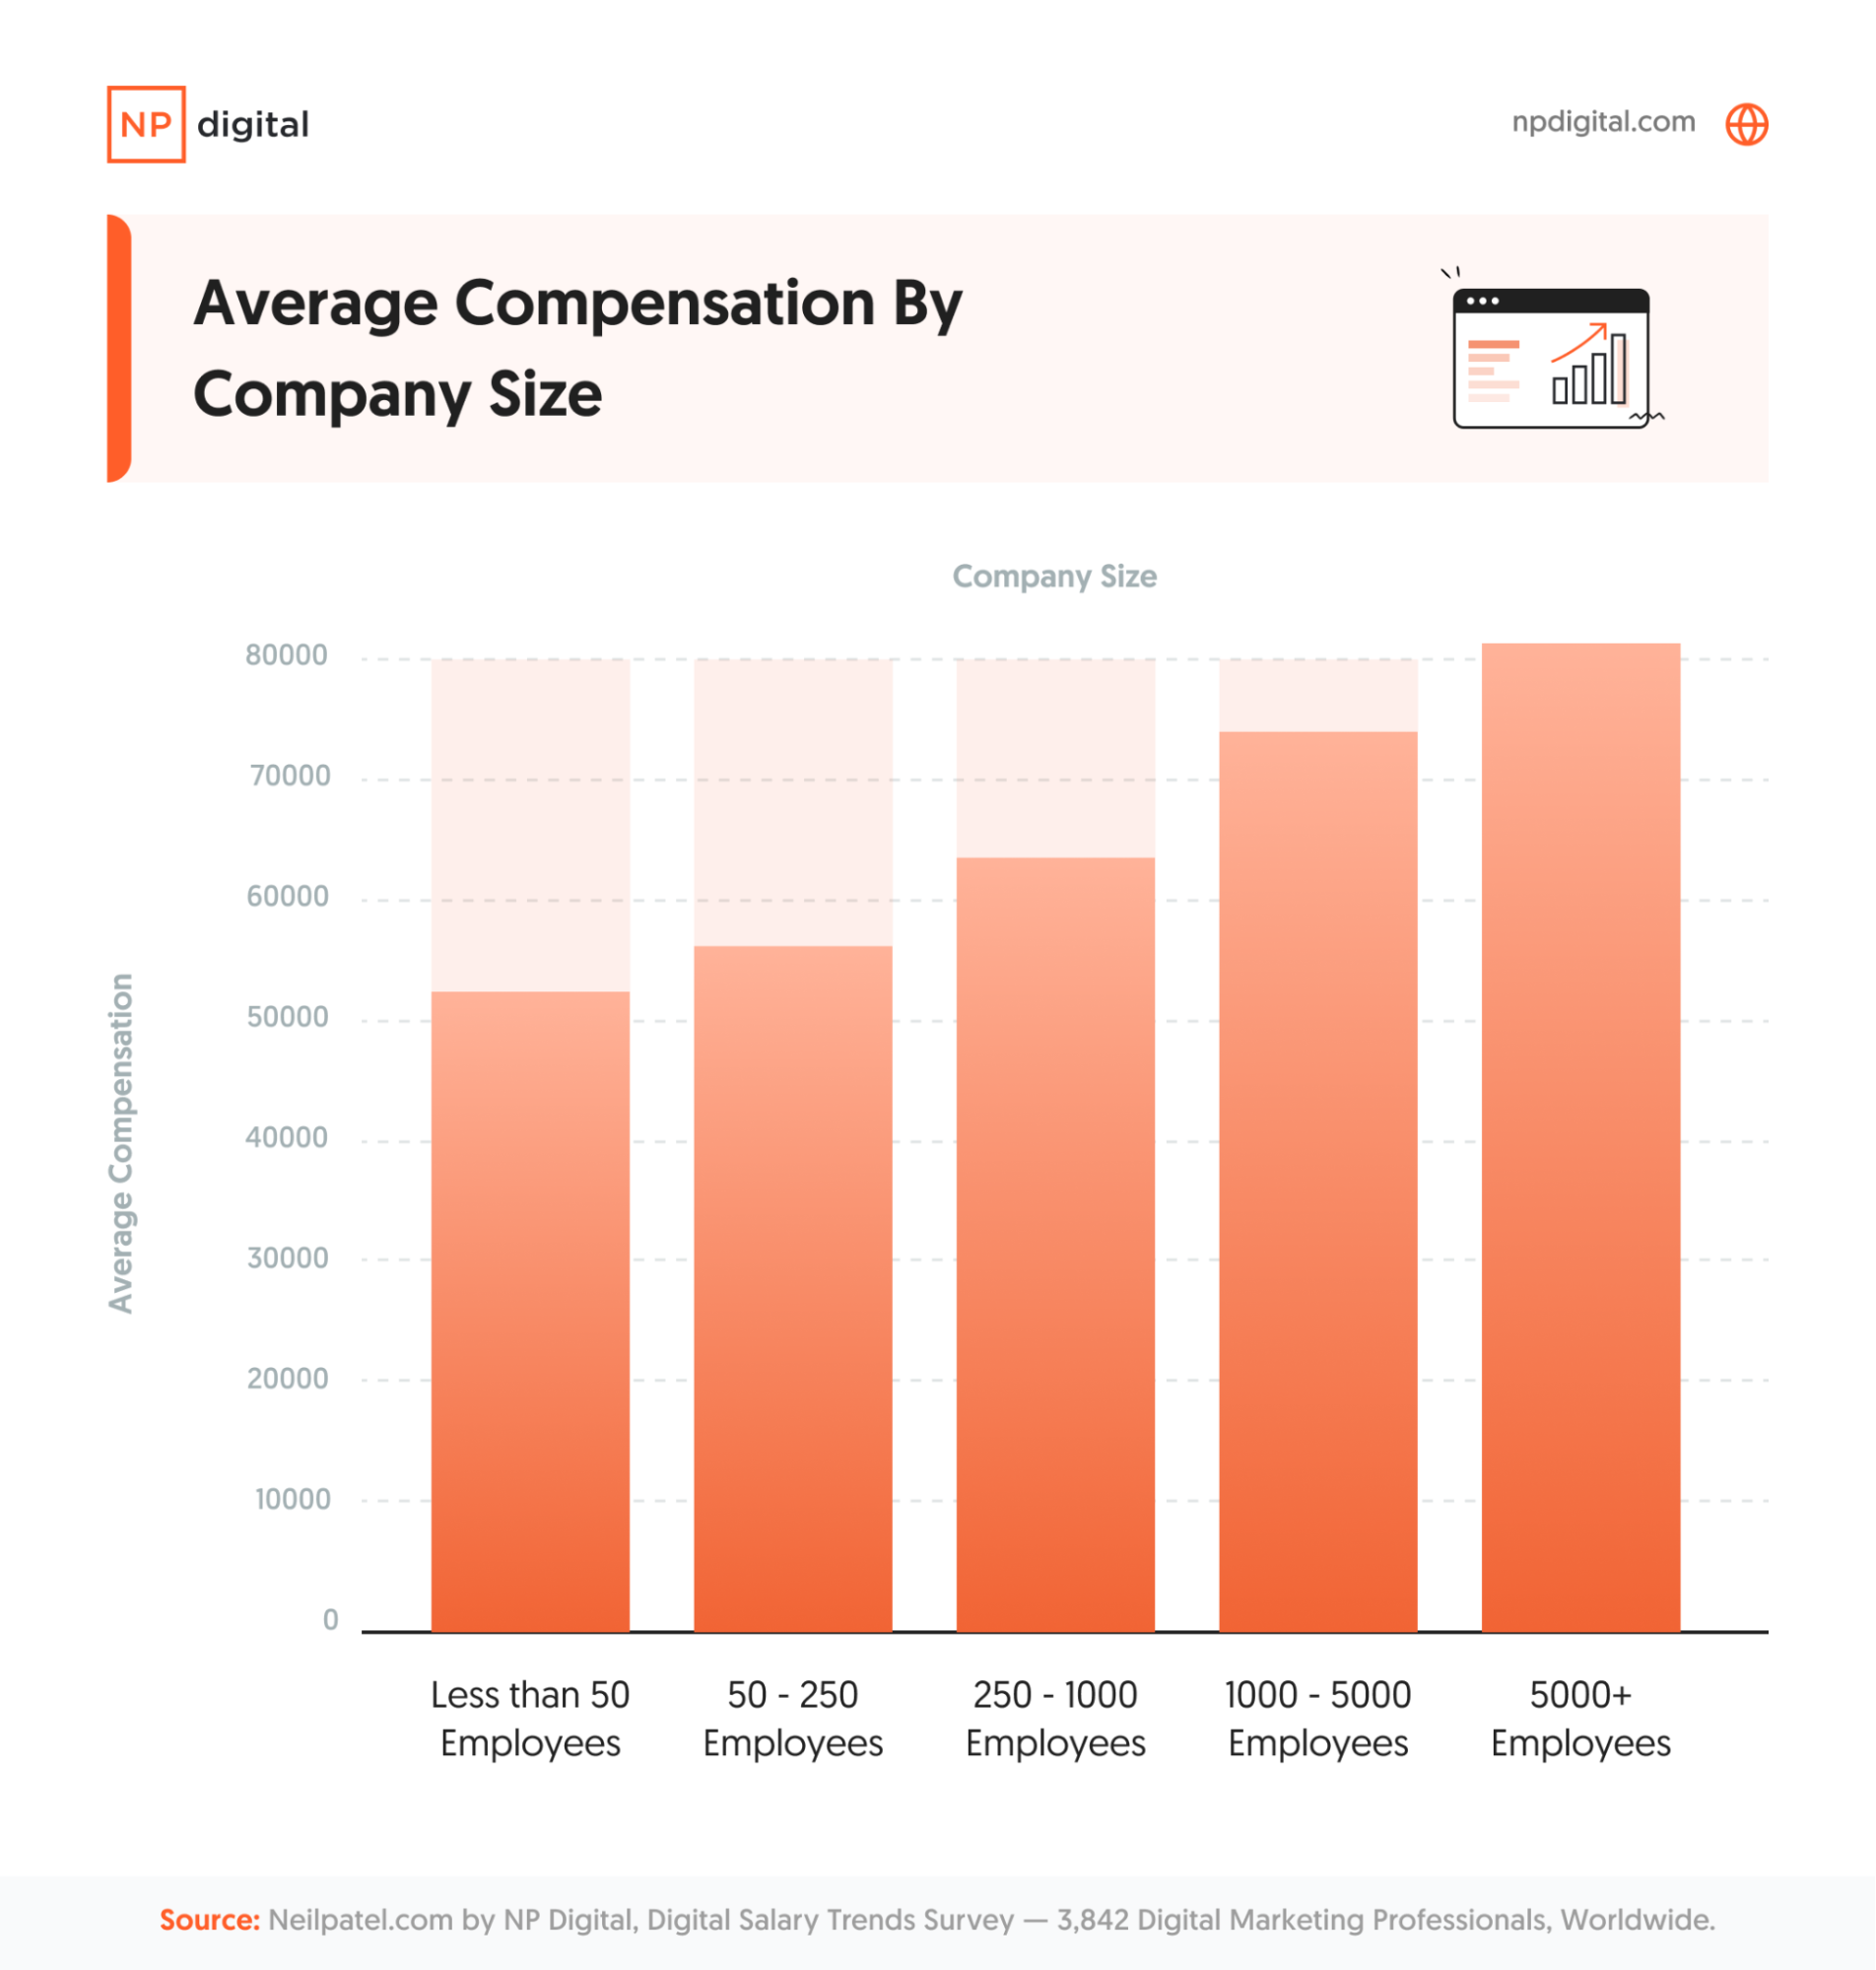
Companies with fewer than 50 employees provide less financial compensation. Large companies with over 5,000 employees are more likely to offer higher salaries.
How Employee Location Trends Are Changing Globally
Remote work has become an accepted norm across many businesses.
It also means that people no longer have to live close to where they work. People can apply for jobs in other states and regions, even other countries. Digital marketing is one such industry impacted by this shift.
Seven percent of our survey respondents live and work in two different countries—a phenomenon known as “location discrepancy.”
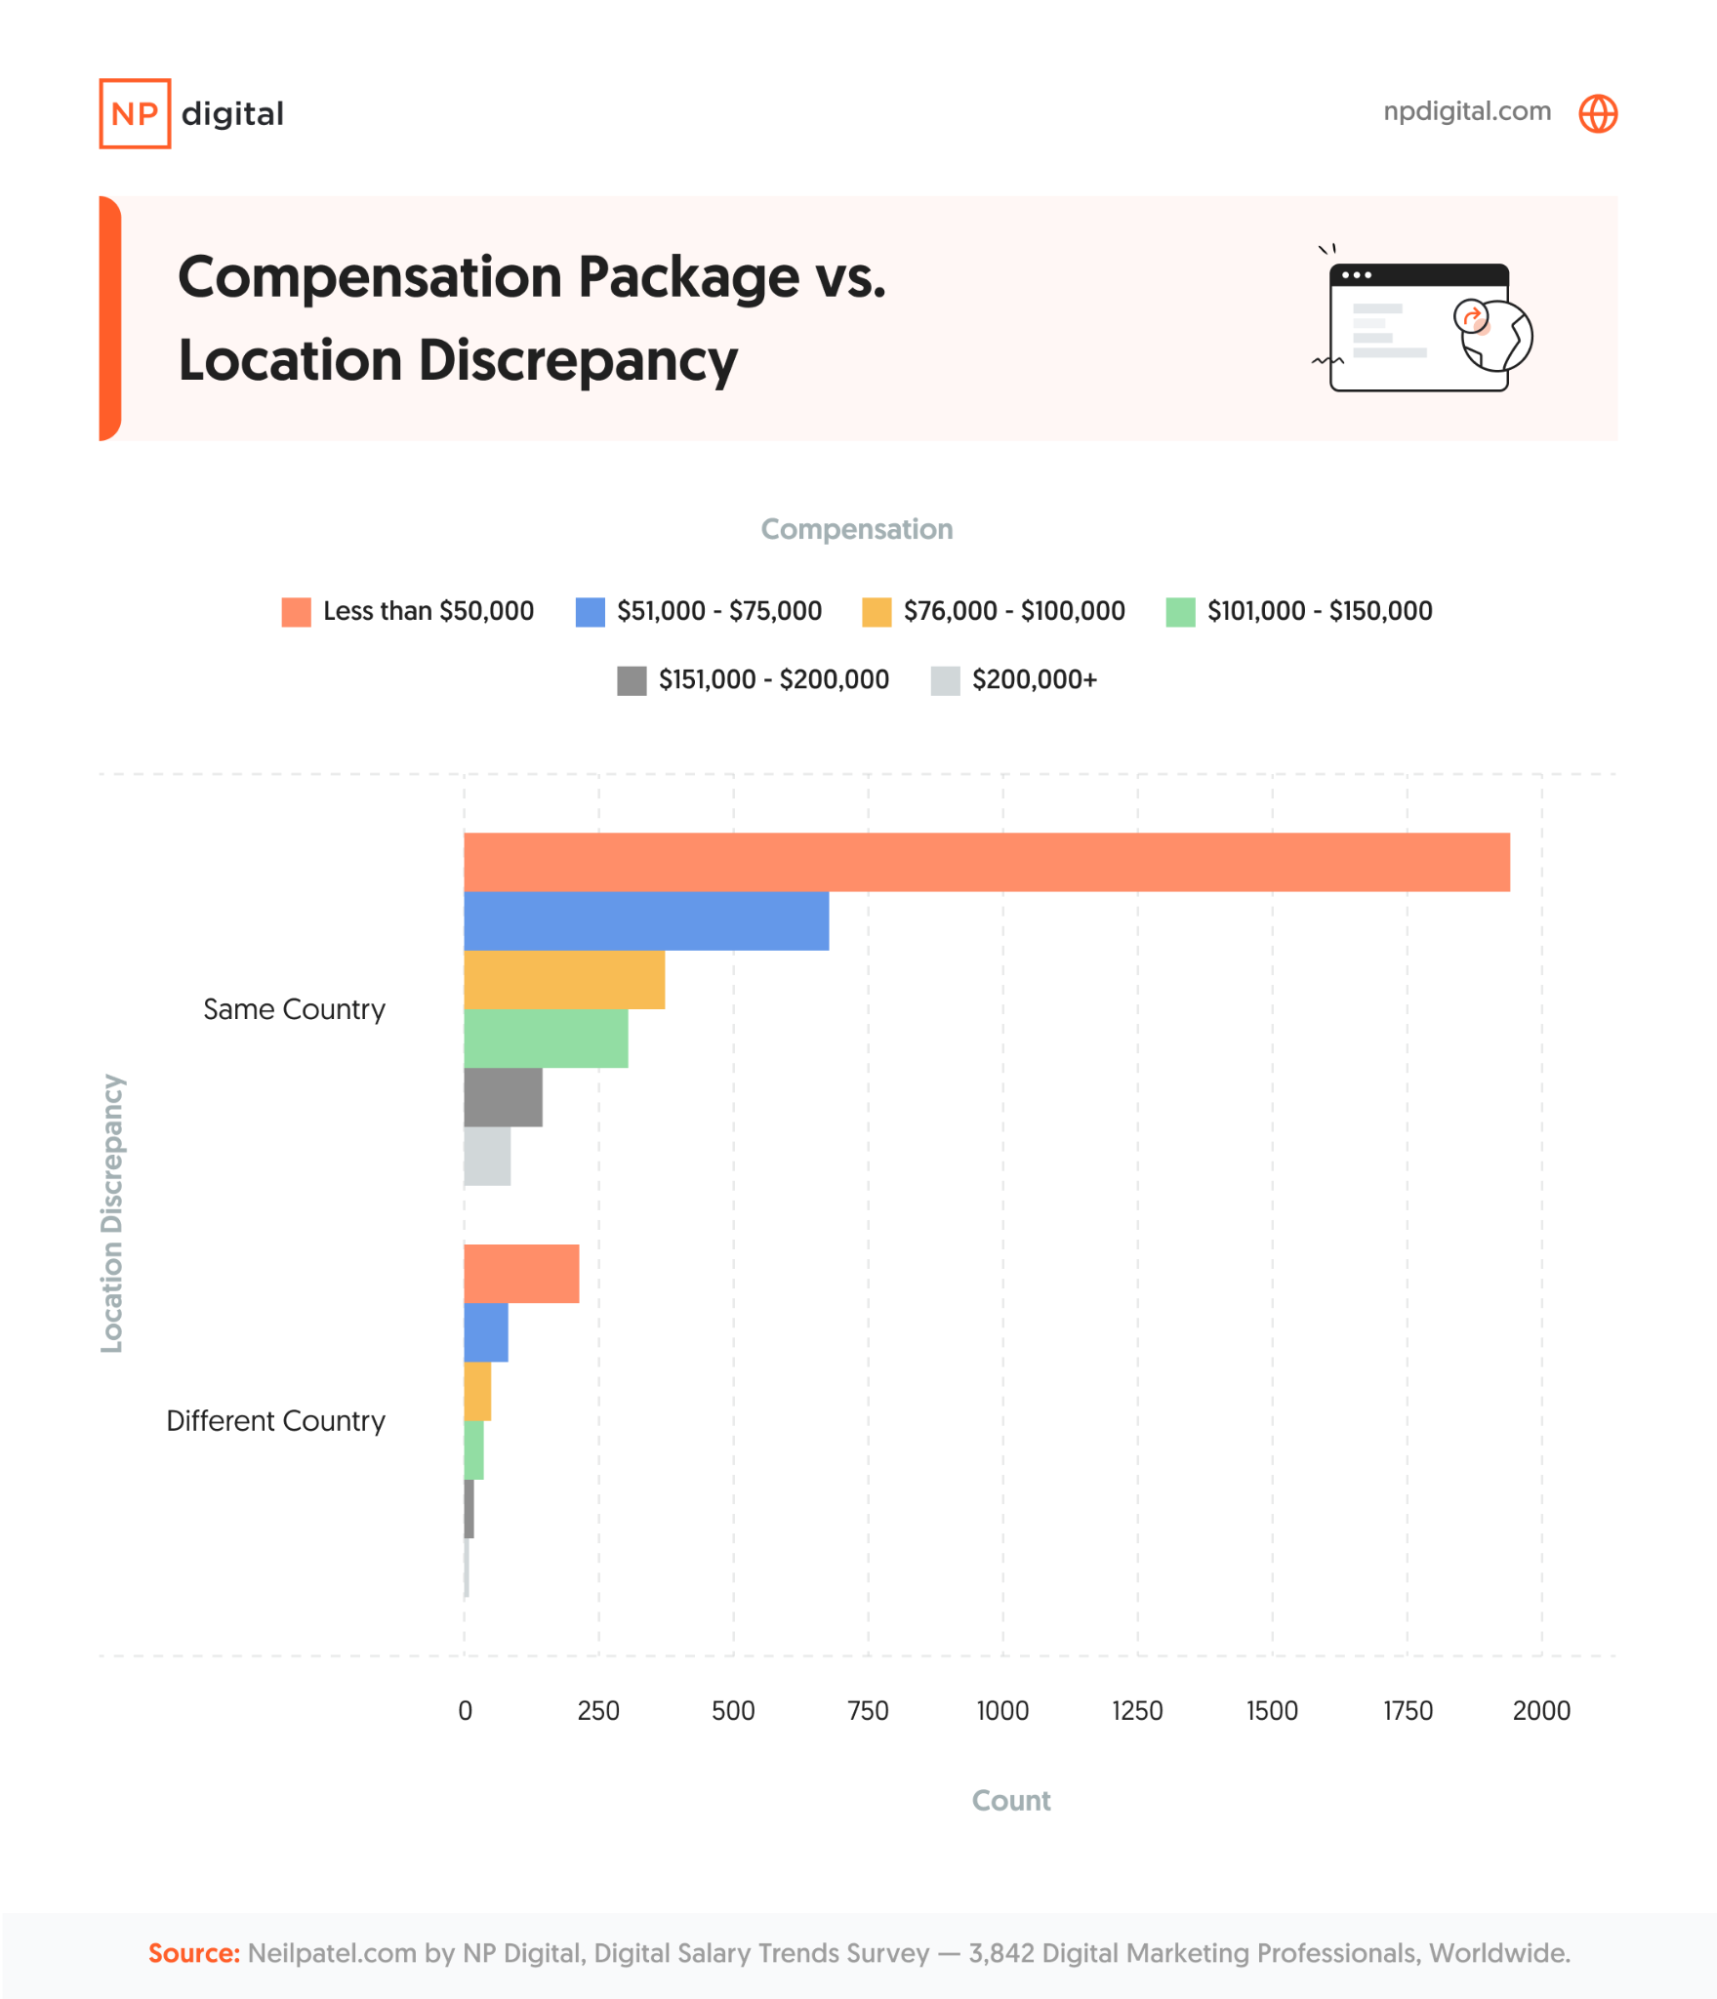
For respondents working in the same countries as their residence, the majority fall into the less-than-$50,000 compensation bracket. For those with a location discrepancy, while many still fall into the lower compensation bracket, there’s representation in the higher compensation brackets, too.
This means many businesses are realizing the benefits that outsourcing work to people in other countries can bring to the table, including:
- Specialized skillsets that aren’t available in their countries’ talent pool
- Significant cost savings
- Increased efficiency (for example, support outside regular working hours)
- Access to brand-new markets
- A fresh new approach to their digital marketing efforts
Next, our team wanted to see if workers with a location discrepancy were happy with their digital marketing salary compared with their peers living and working in the same country.
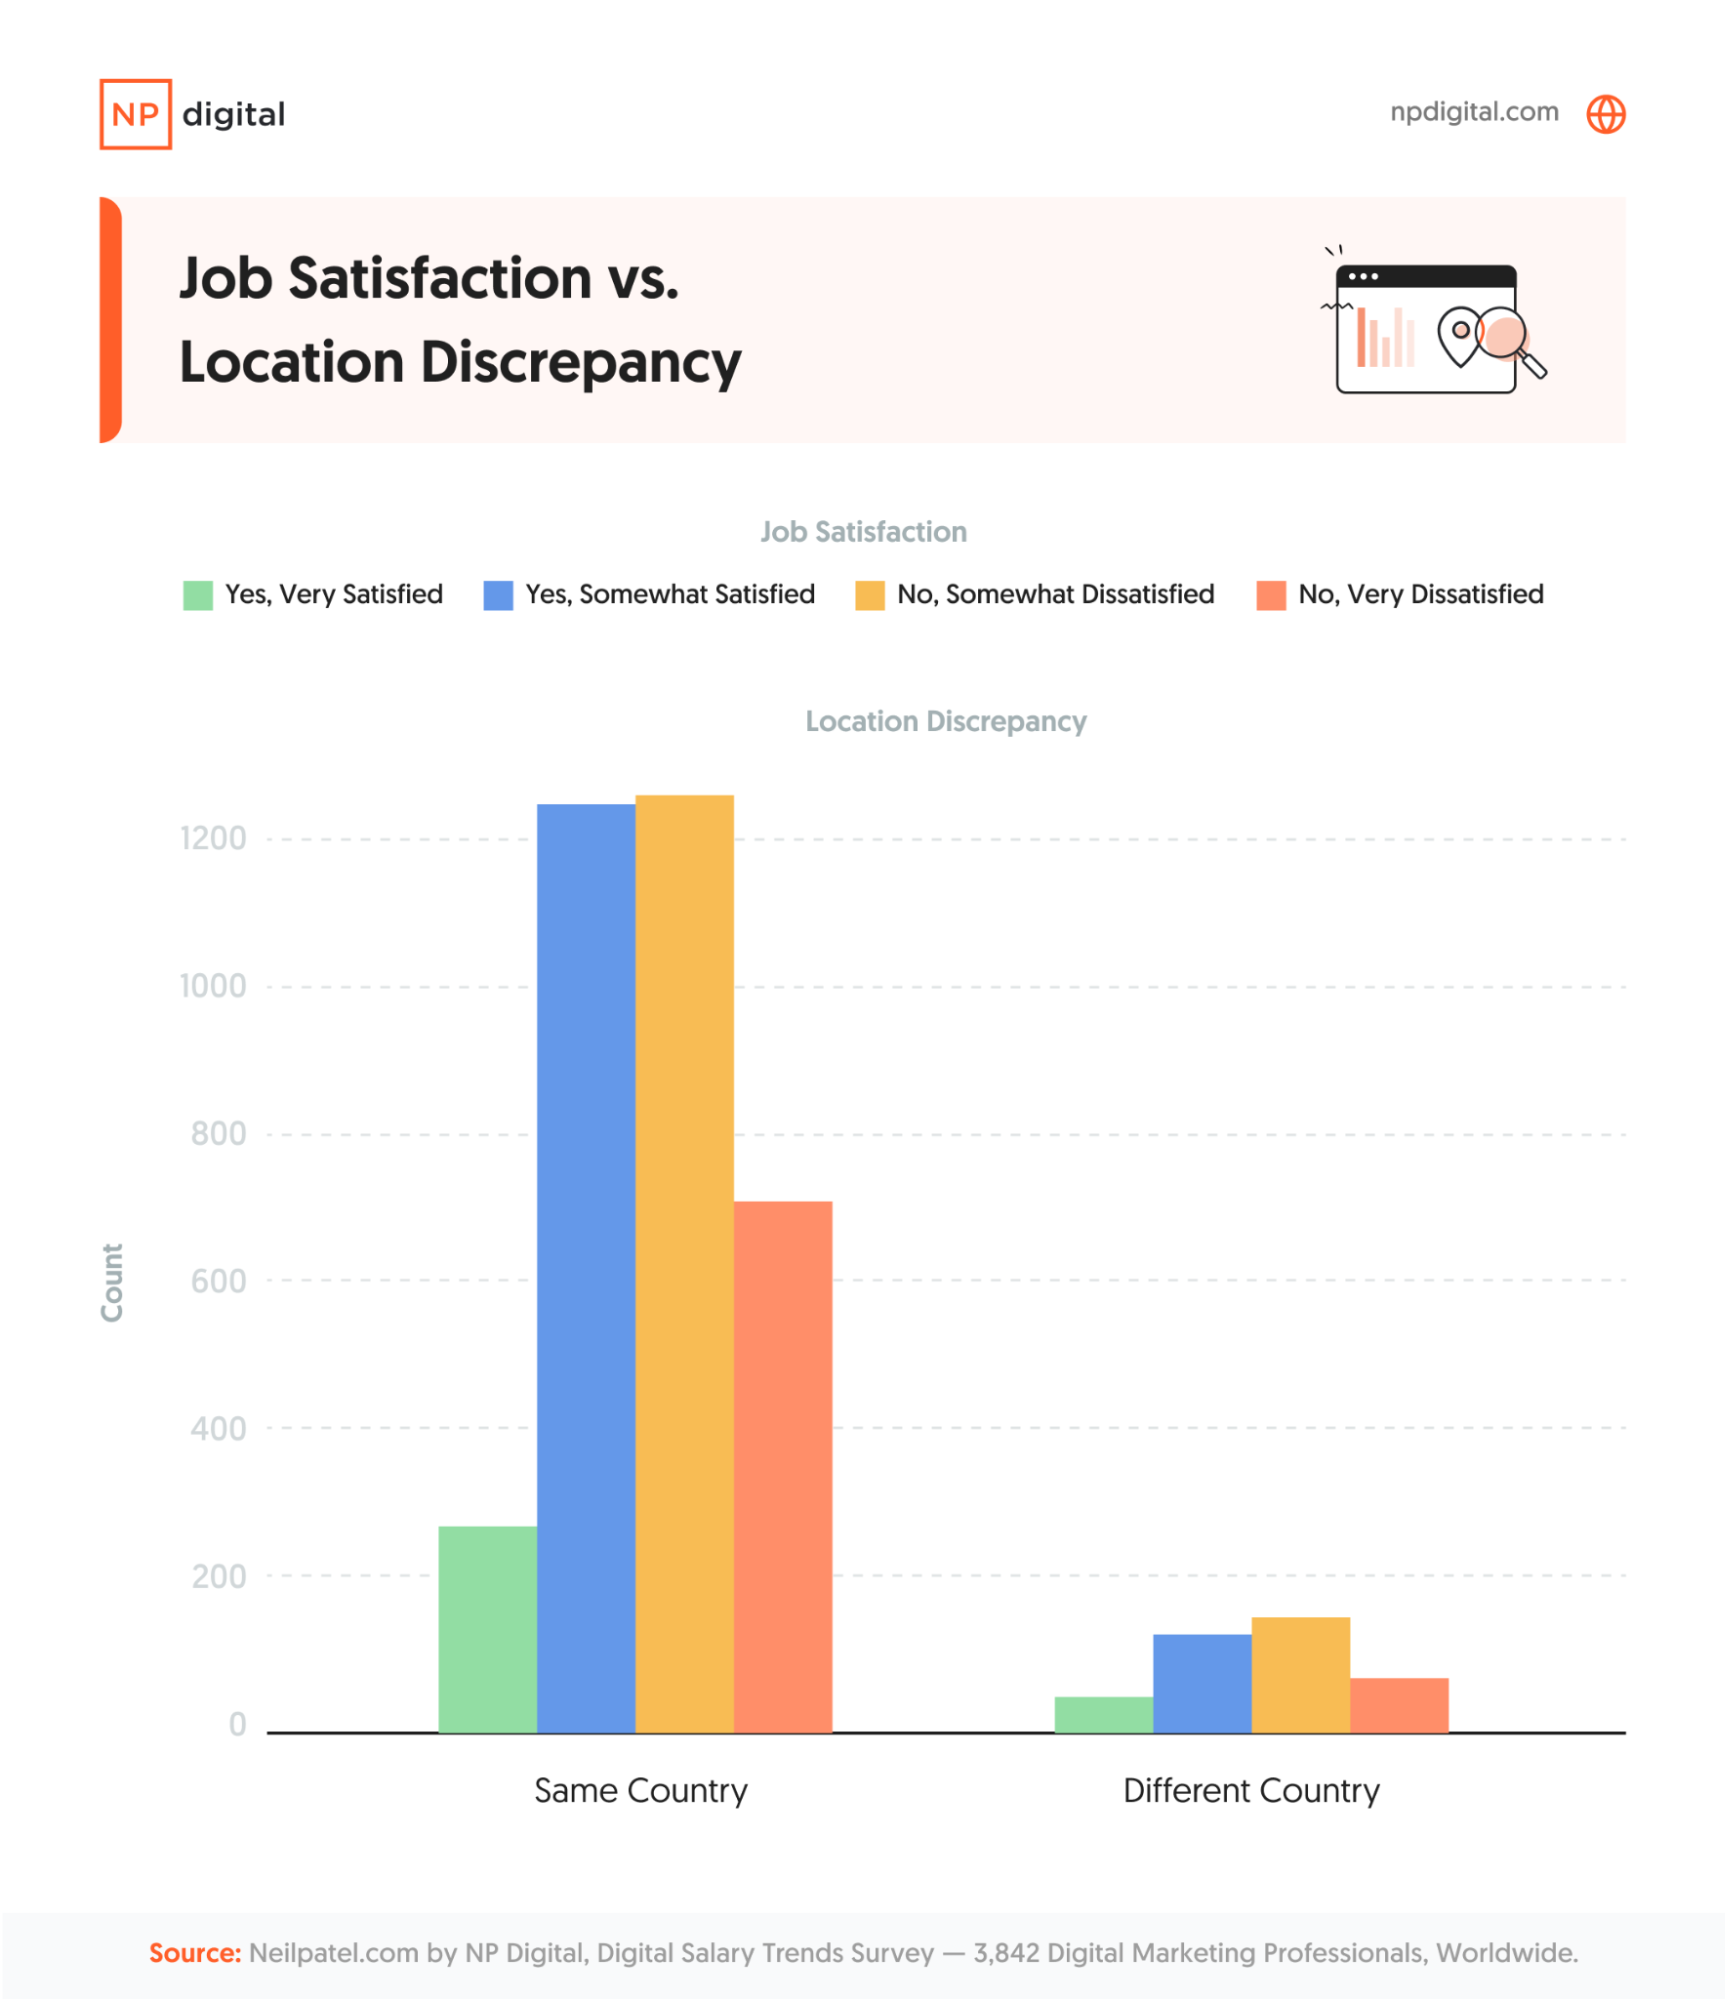
The bar chart above shows a relatively balanced distribution between satisfaction and dissatisfaction for people working and living in the same country—although for those with more extreme feelings, things trended toward dissatisfaction. These feelings are largely mirrored in other countries.
Why is this the case? In some scenarios, the same factors that drive dissatisfaction or satisfaction may be universal whether working in the same country or remotely. Digital marketing companies should be focused on those universal factors that make a place enticing to work at.
Remote Working and Salary Trends
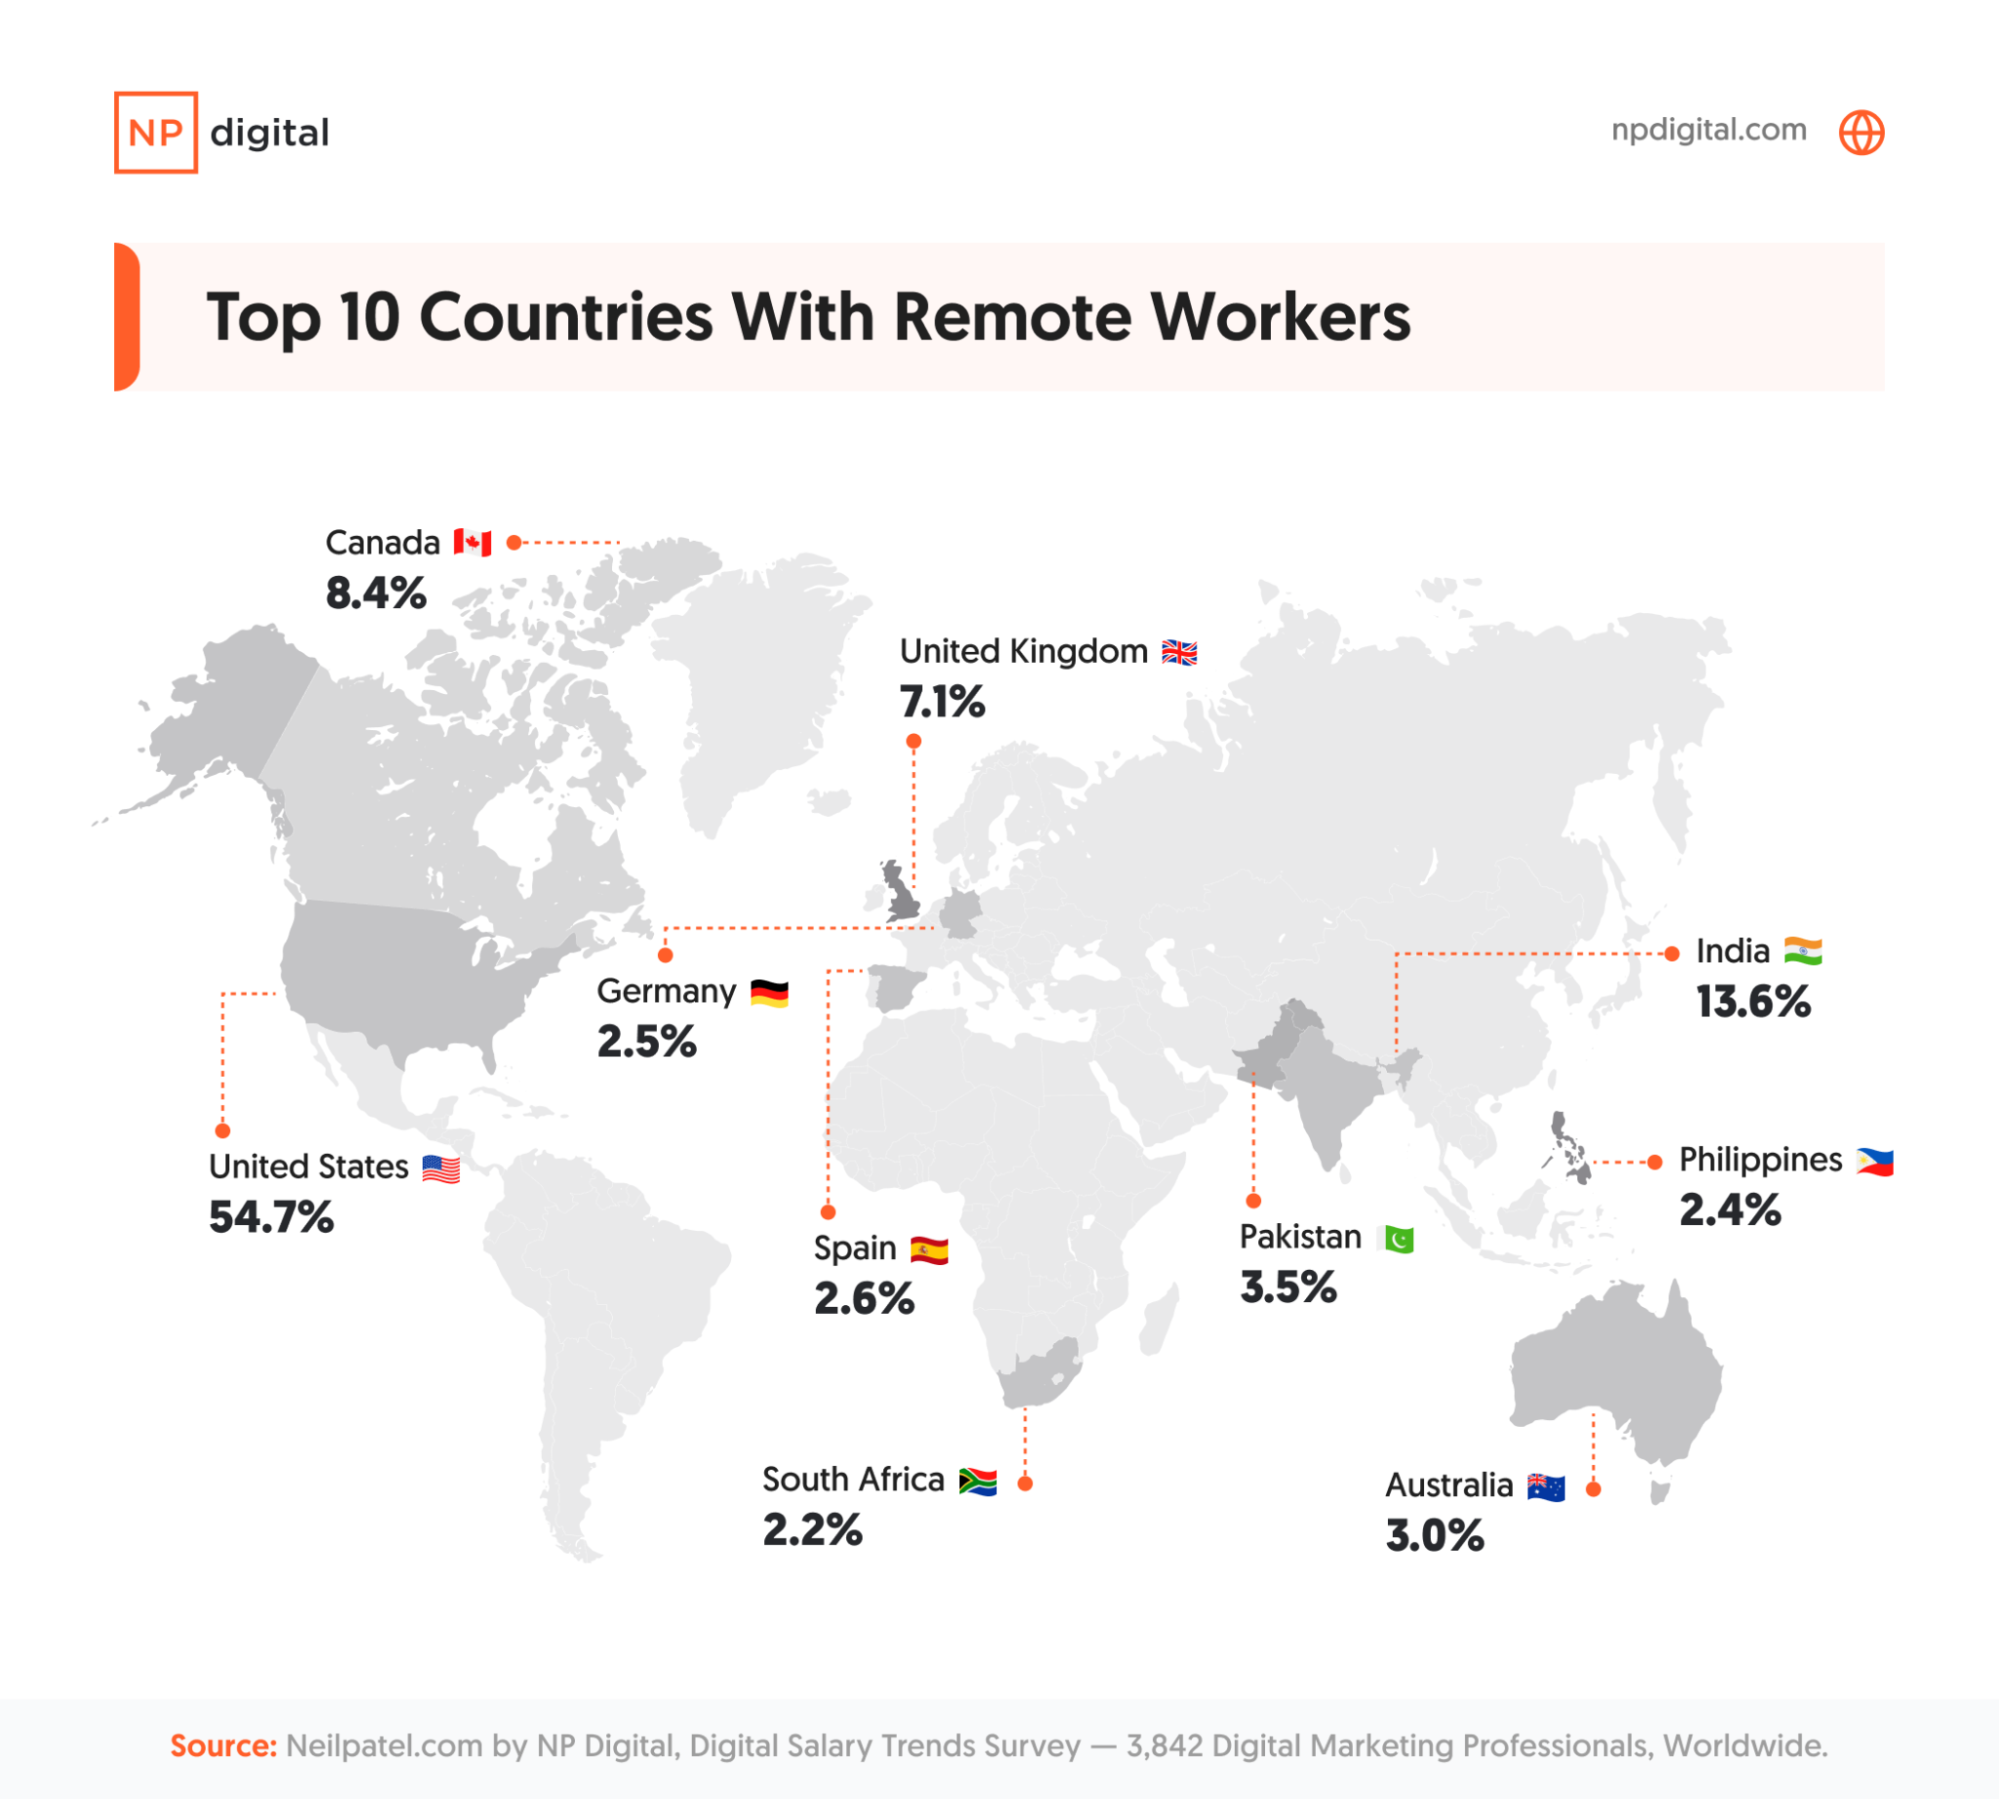
We received responses to our digital marketing salary trends survey from more than 100 countries. While remote working occurs in all the countries surveyed, it’s more prevalent in some countries than others, with the U.S. leading the pack at 54.7 percent.
When we look at non-U.S. countries in the world of salary trends, here are the top 10 for remote working in the digital marketing sector:
- India (13.6 percent)
- Canada (8.4 percent)
- United Kingdom (7.1 percent)
- Pakistan (3.5 percent)
- Australia (3.0 percent)
- Spain (2.6 percent)
- Germany (2.3 percent)
- Philippines (2.4 percent)
- South Africa (2.2 percent)
- Brazil (1.6 percent)
So, is there a correlation between a high number of remote workers and digital marketing salaries? It depends on the country you’re working in.
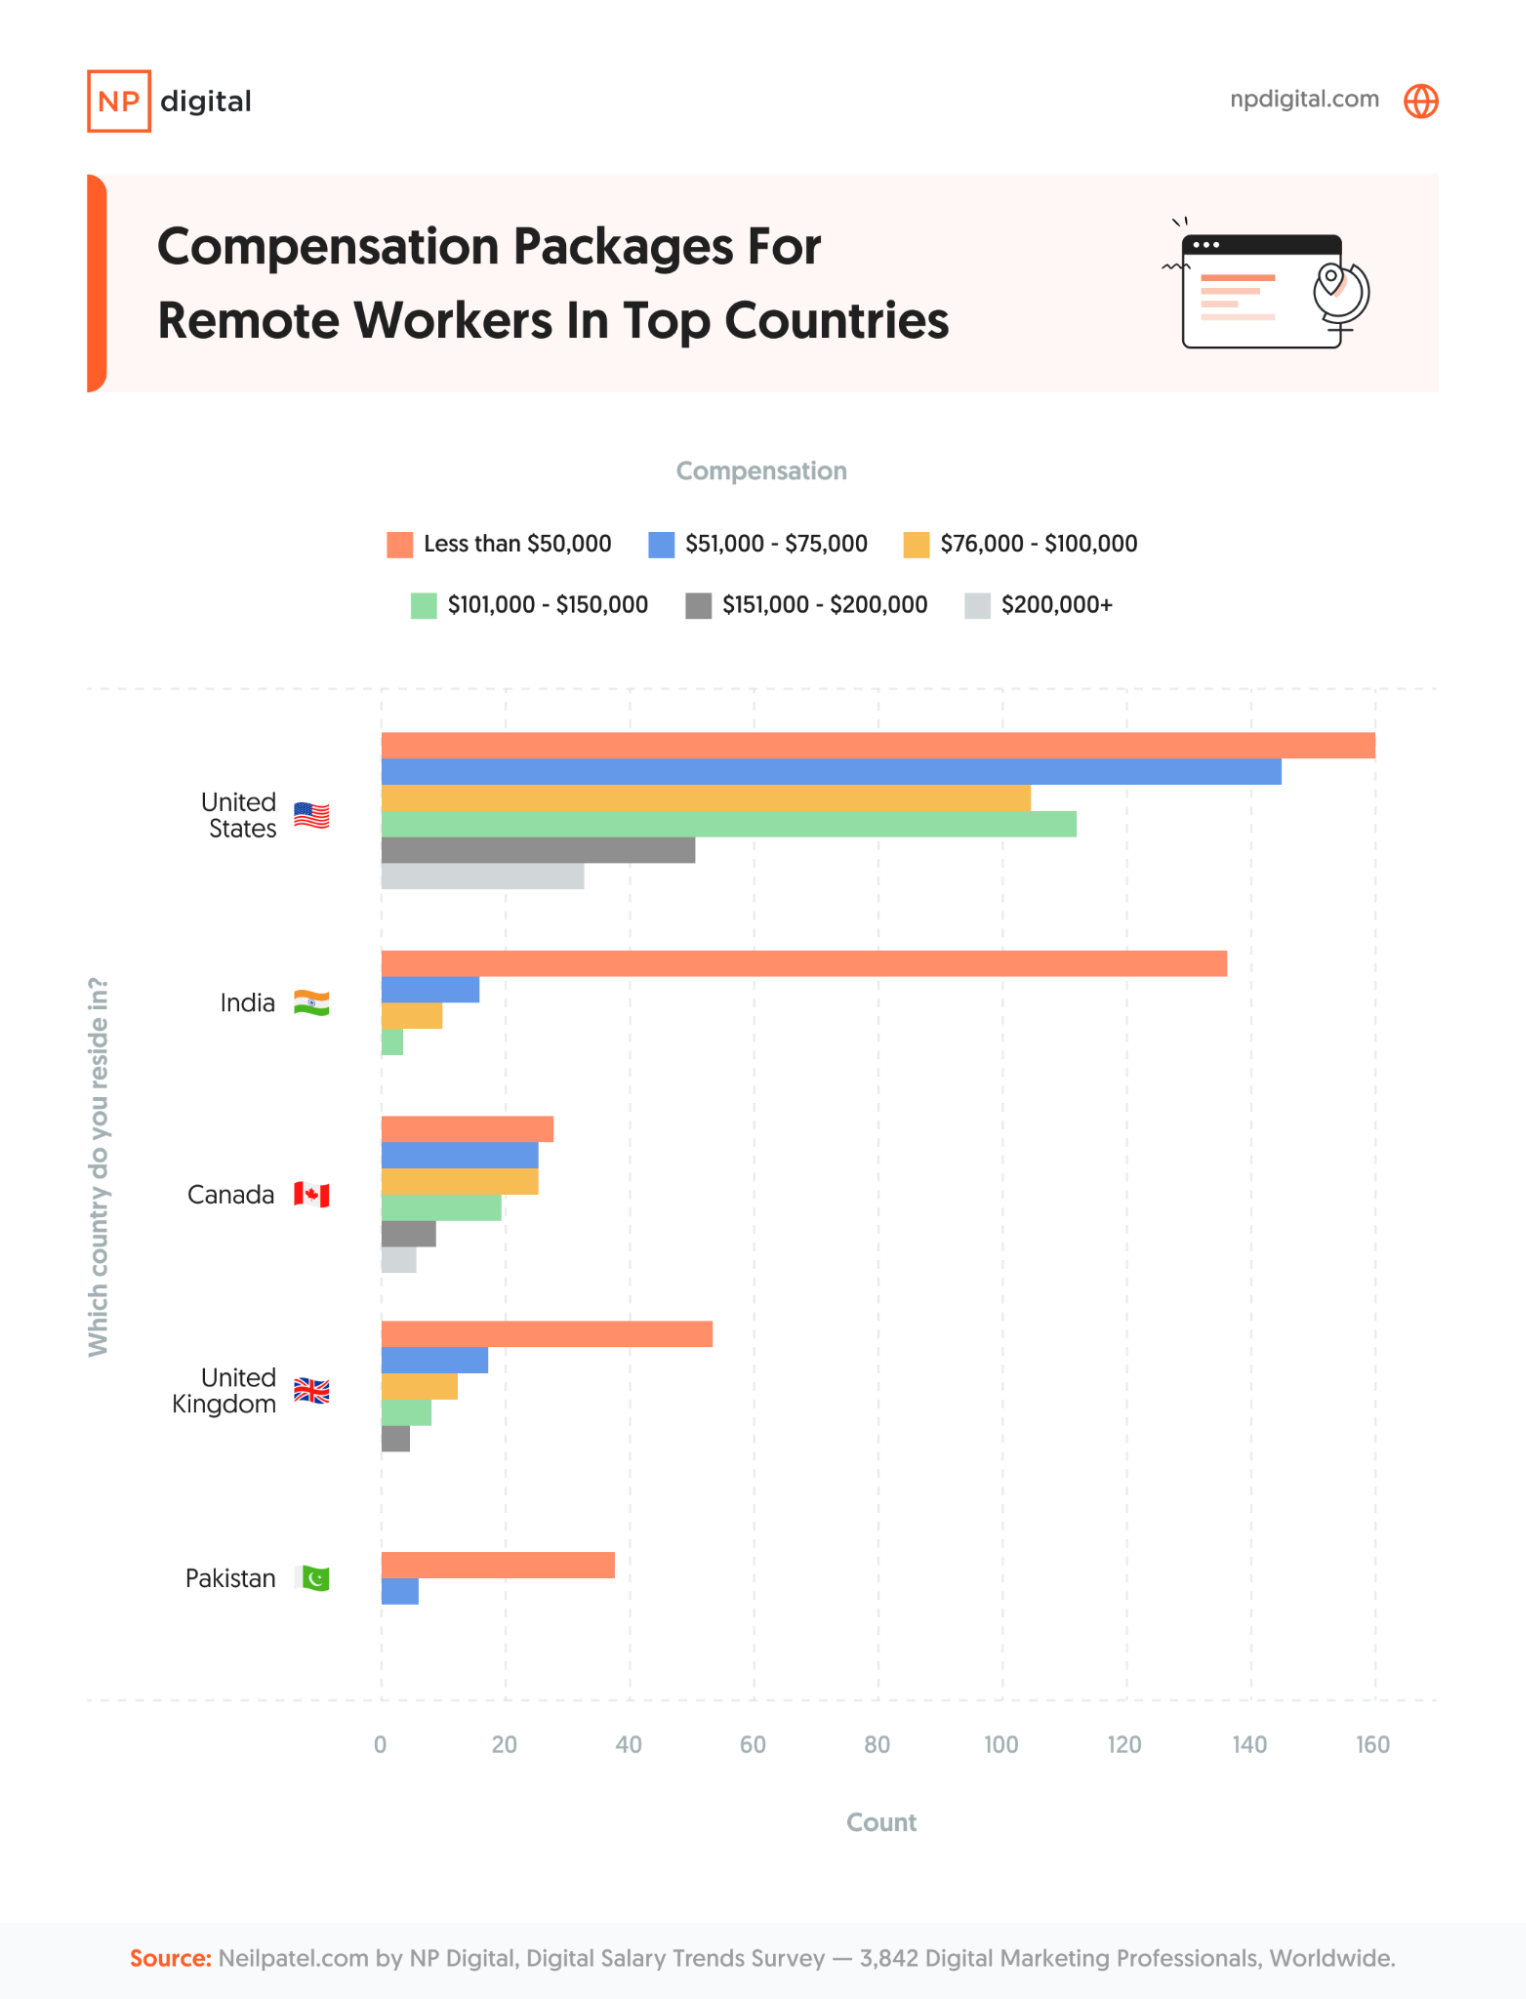
While the U.S. creates an inflated perception of remote earning power, the majority of remote workers in countries like India and Pakistan earn less than $50,000.
Why is there such a disparity? In some countries, remote workers can often request a more competitive salary due to the skills and experience they have. In others, remote workers may be willing to take a lower salary in exchange for the flexibility and other benefits remote work provides.
Are Marketers Discussing Compensation Globally?
Some digital marketers see discussing their compensation with other marketers as taboo or unprofessional. Others even think it can lead to dismissal.
In the U.S., under the National Labor Relations Act (NRLA), employees have the right to talk about compensation with their colleagues. Legislation in other countries, like the Equality Act in the United Kingdom and the Employment Relations Act in New Zealand, offer the same protection.
However, it’s important to note that some countries—such as Japan or South Korea—don’t have specific laws that give employees the right to discuss salary. As this survey received feedback from so many countries, it’s critical to bear this in mind.
We wanted to see if people who were happy with their salary compensation were more likely to discuss it with their peers. The digital marketing salary survey results showed that respondents who kept their compensation private were generally more dissatisfied with their overall compensation package.
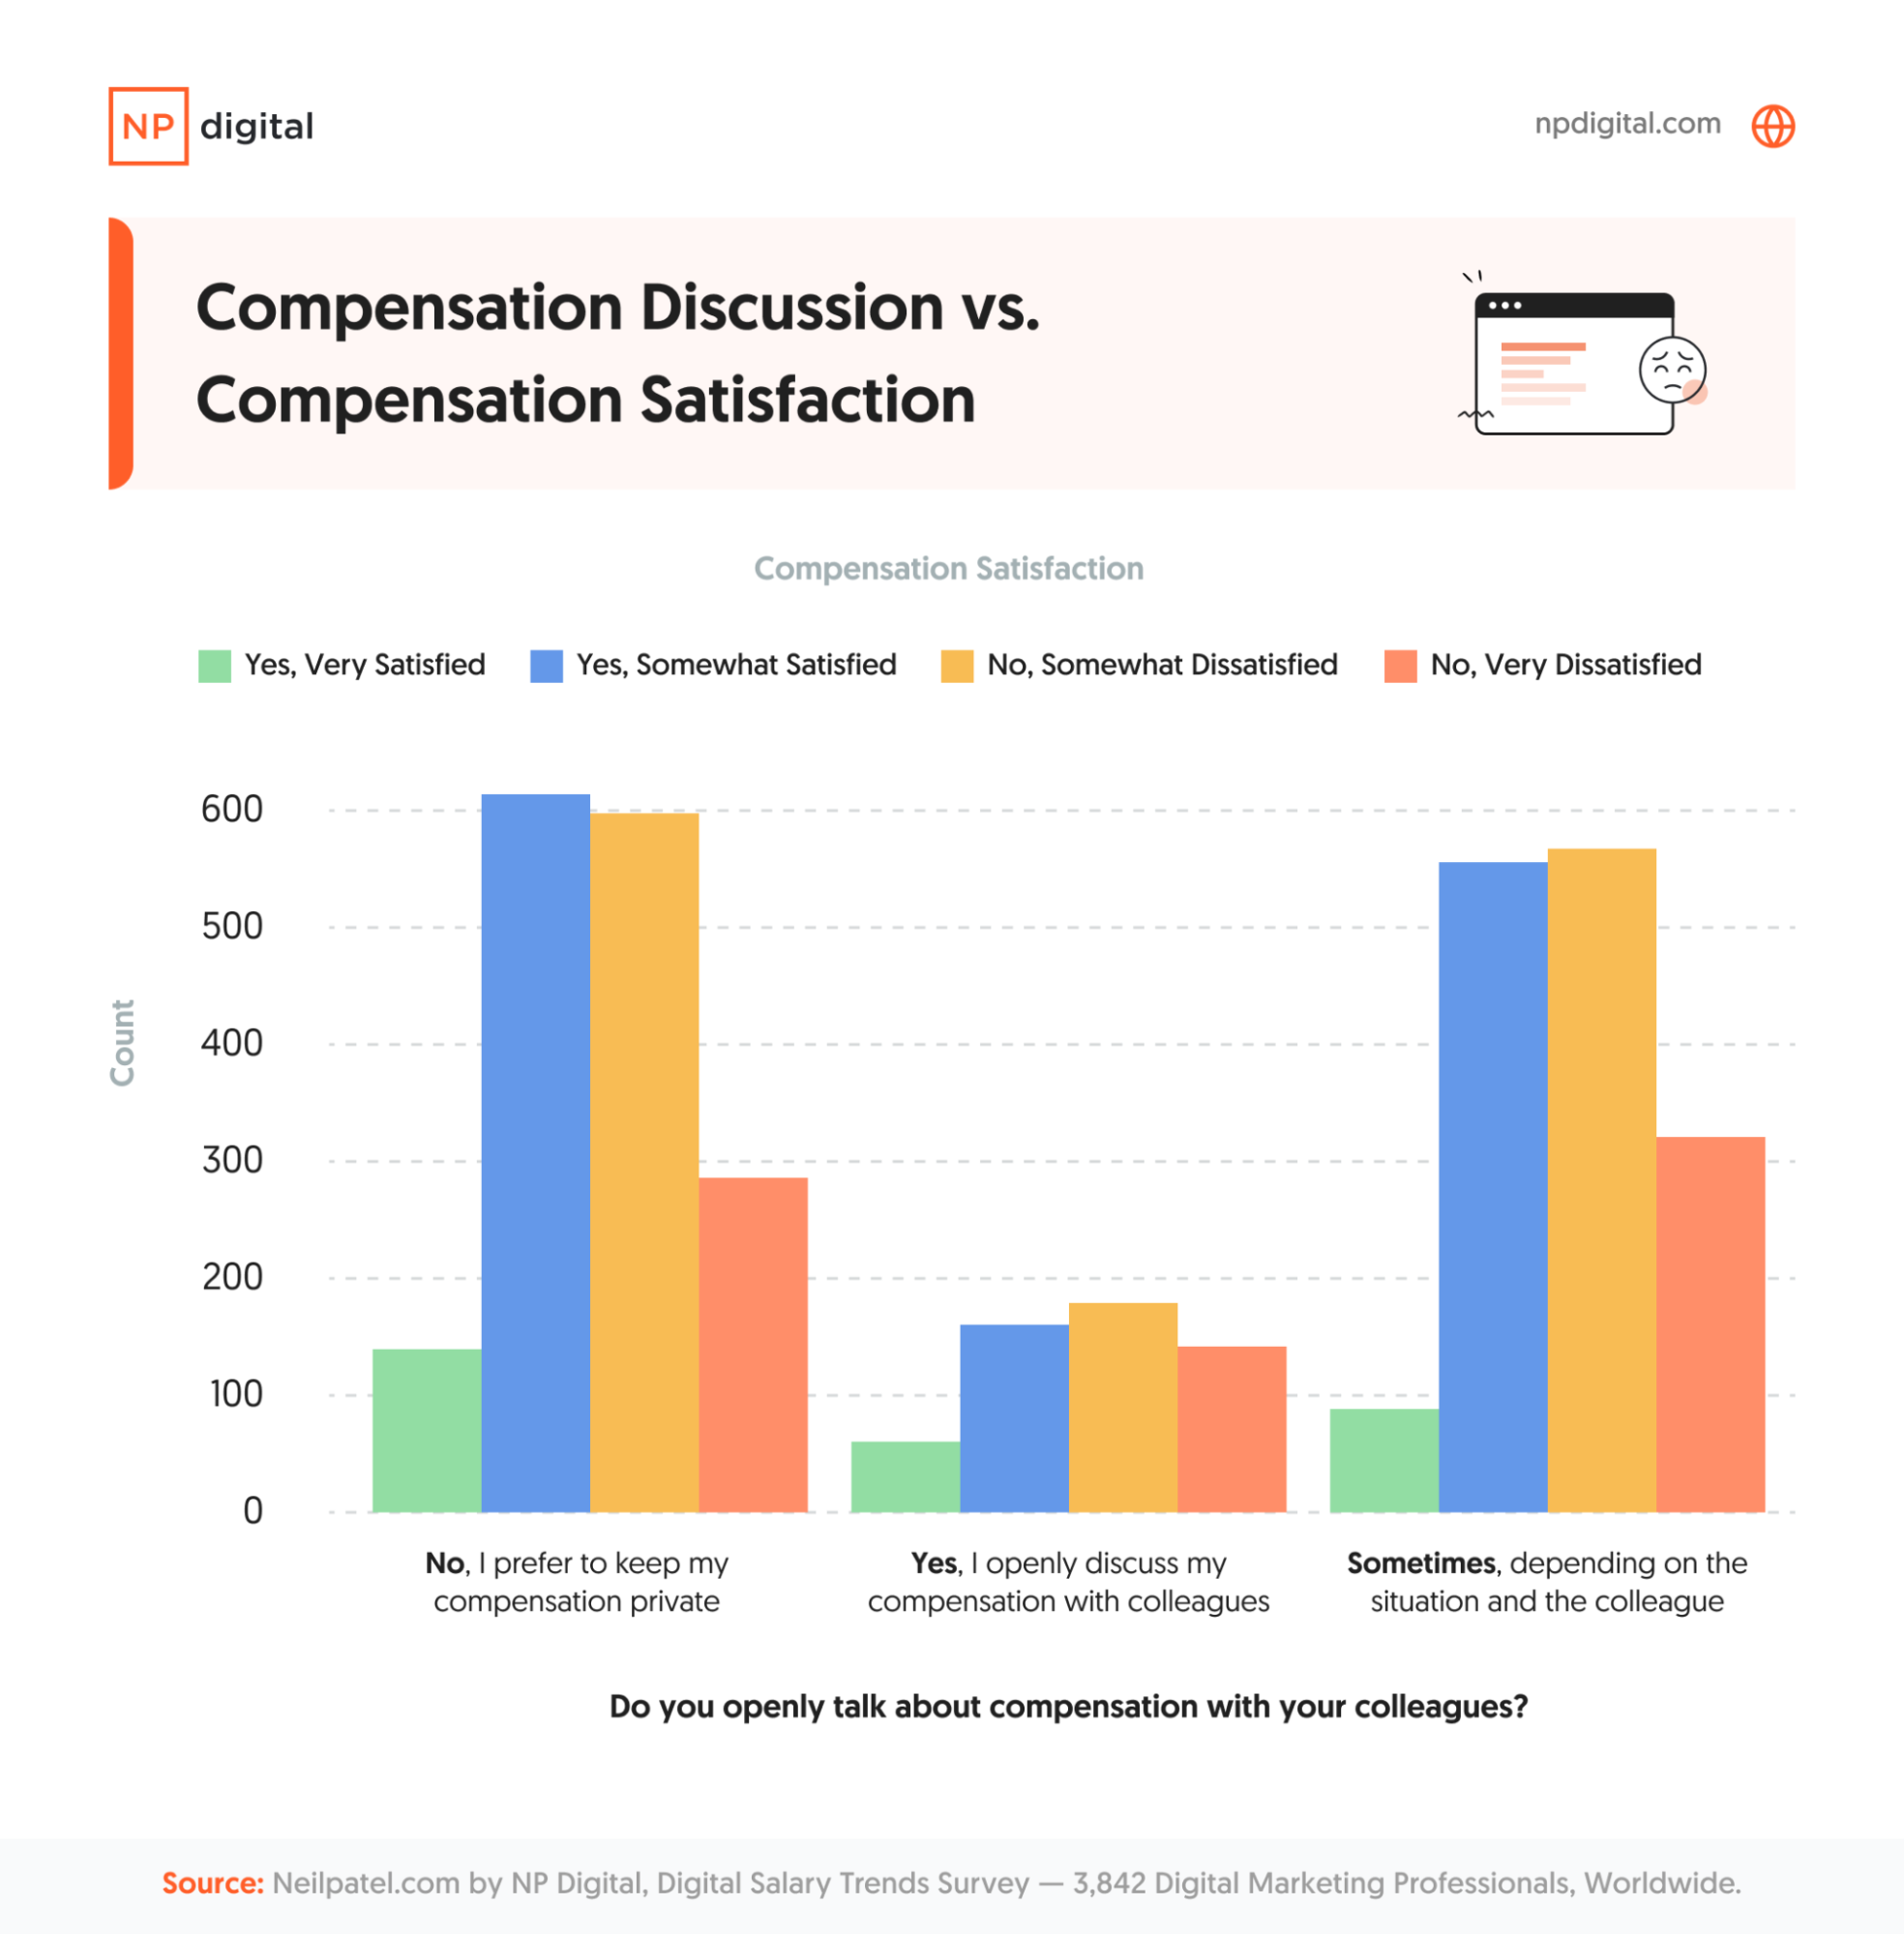
Those who discuss compensation have a relatively close split between satisfaction and dissatisfaction, leaning slightly toward dissatisfaction.
Interestingly, the lines start to blur when looking at respondents who sometimes discuss their compensation depending on the situation. Some are happy with their financial compensation, while others are not. It may be that this group is willing to discuss their pay with colleagues who feel the same way as they do for reassurance.
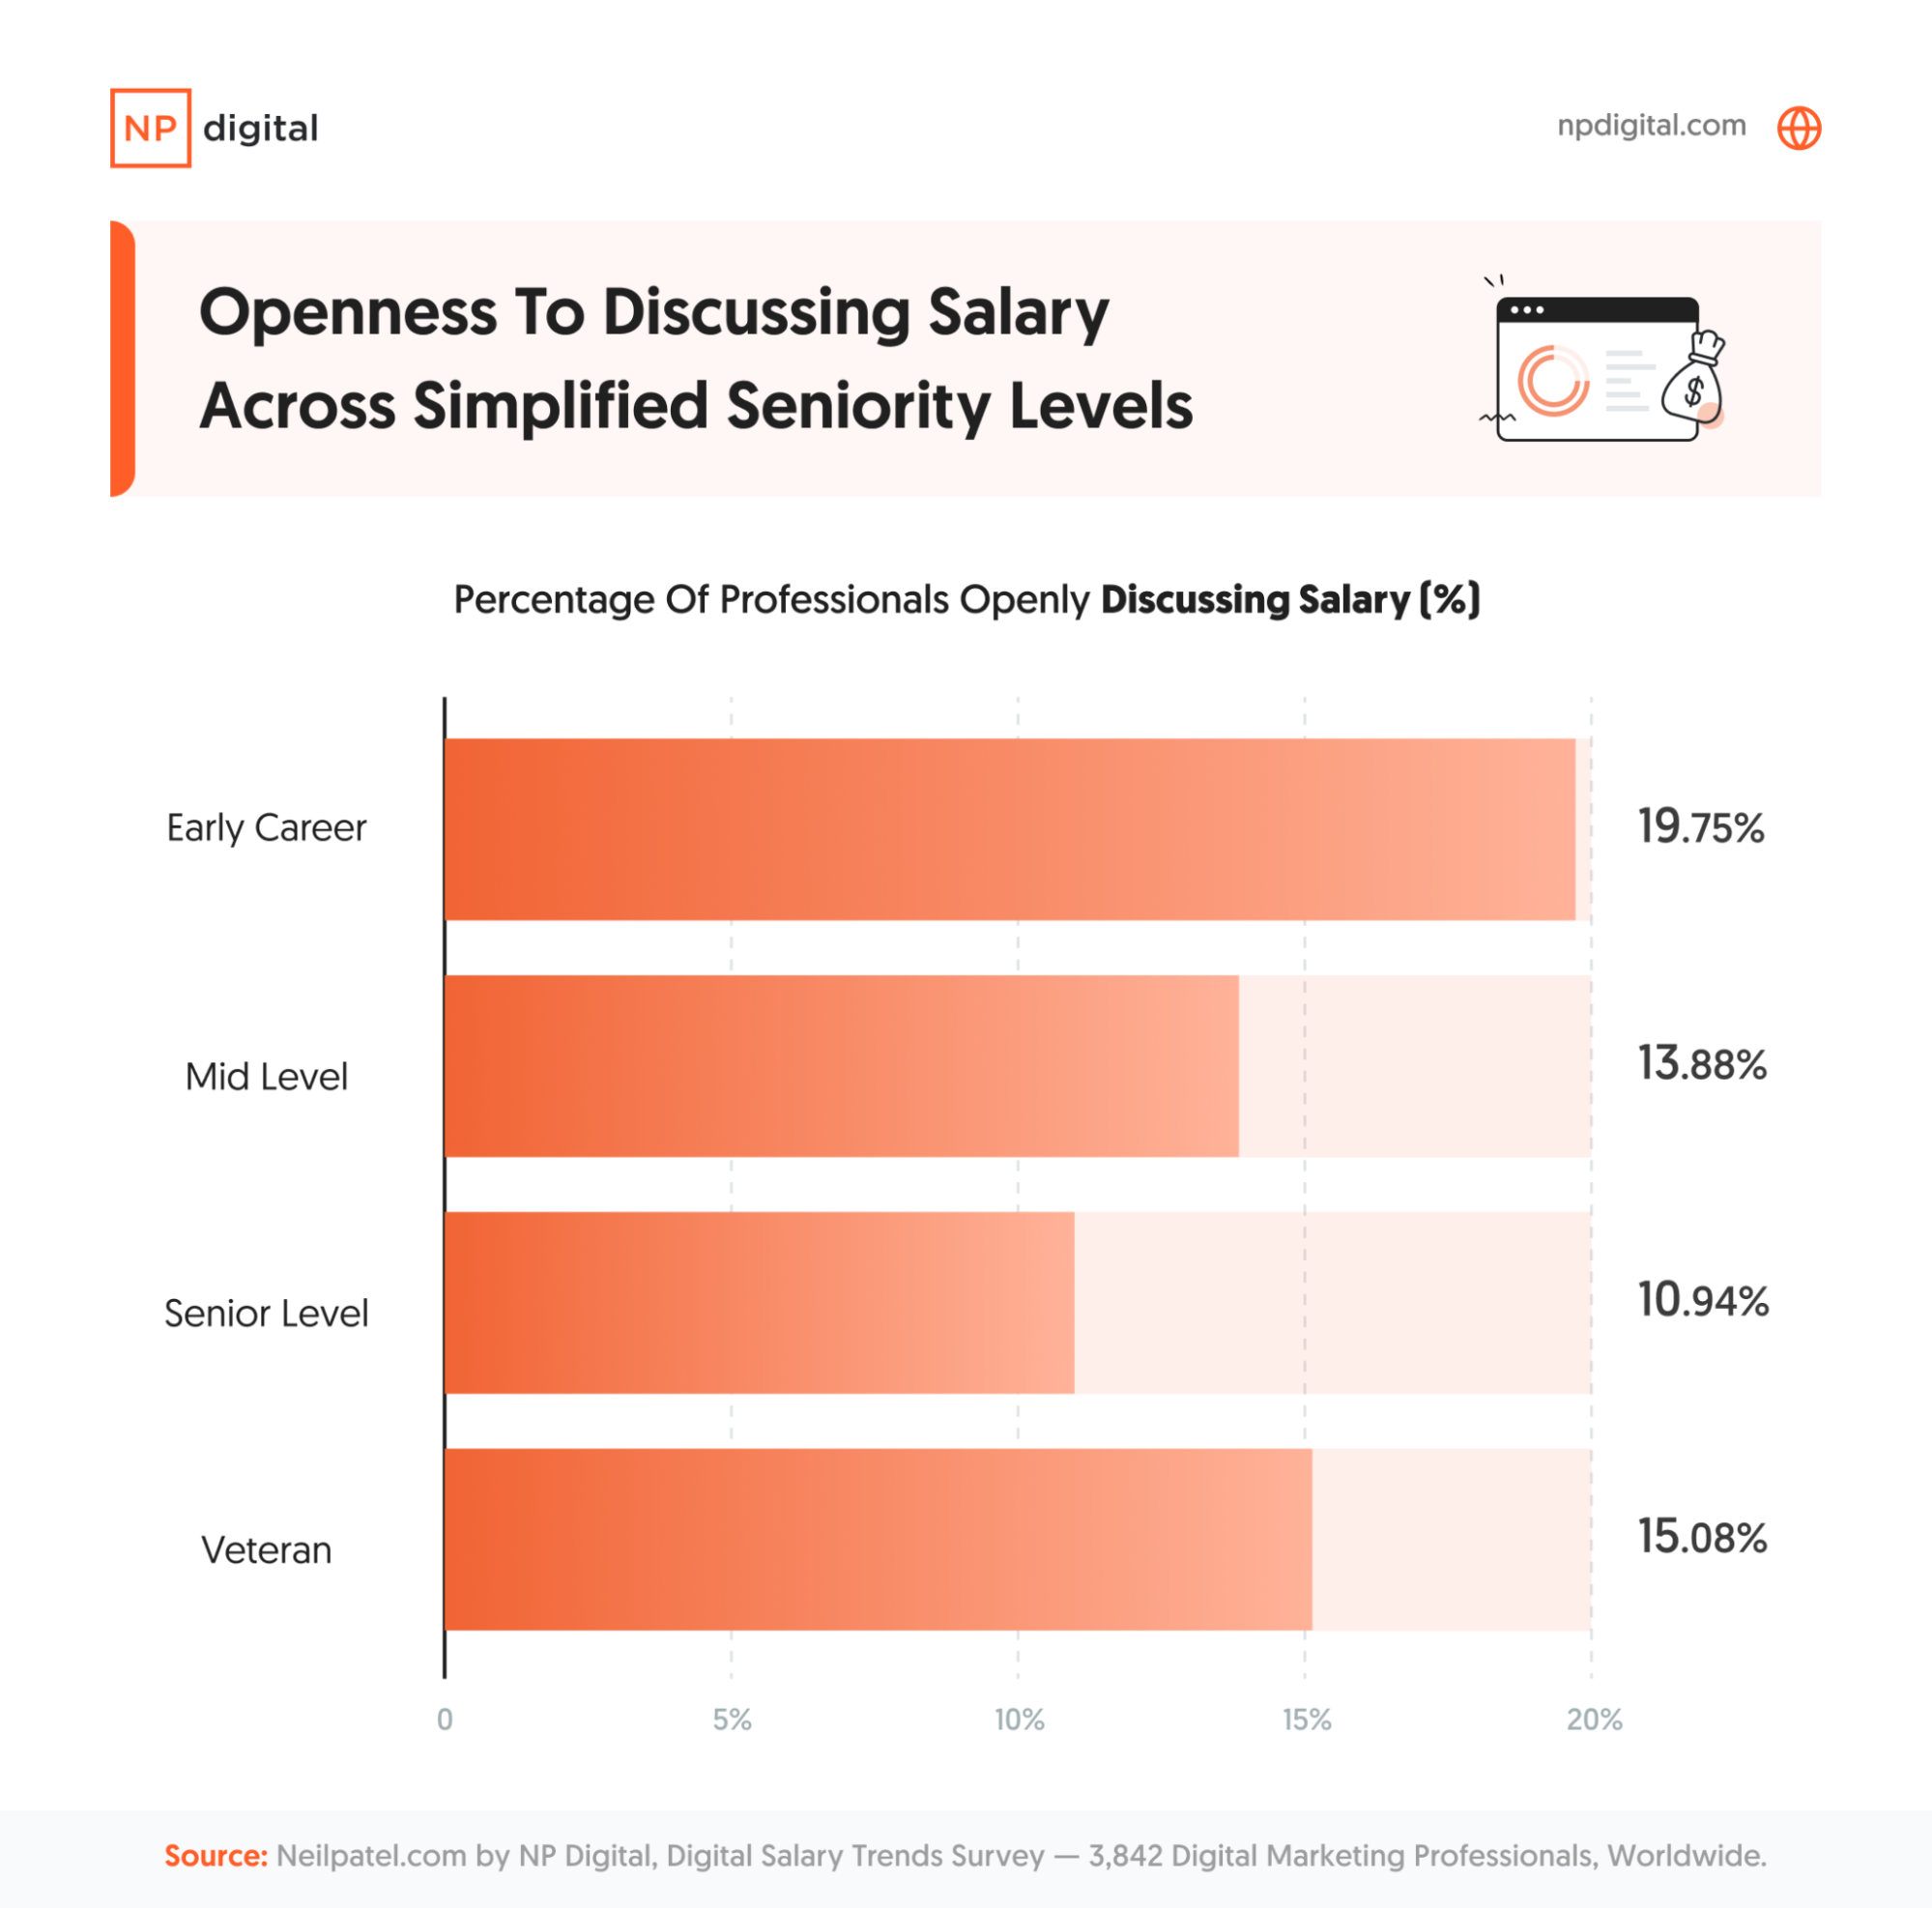
Let’s look at discussions around compensation in a little more detail. The following chart shows openness to discussing salary across seniority levels.
Here are the definitions of seniority levels for this analysis:
- Early career: Two to five years
- Mid-level: Six to 10 years
- Senior level: 11 to 15 years
- Veteran: More than 15 years
Here’s a look at the full breakdown of responses across seniority levels as well:
| Seniority level | Yes (percent) | No (percent) | Sometimes (percent) |
| Early Career | 19.75 | 35.97 | 44.28 |
| Veteran | 15.08 | 44.91 | 40 |
| Mid-level | 13.88 | 45.81 | 40.31 |
| Senior-level | 10.94 | 44.91 | 44.15 |
It’s interesting to see the different values between more experienced and less experienced marketers. Individuals at the start of their careers are typically most open to discussing their salaries, indicating a generational shift toward transparency.
Meanwhile, those with more seniority are less open to discussing their salaries, suggesting that experienced professionals, perhaps with higher salaries, may prefer to keep things private.
Job Satisfaction and Benefits
It’s not just about the money, but the perks.
This chart investigates the relationship between job satisfaction and the benefits that respondents value the most.
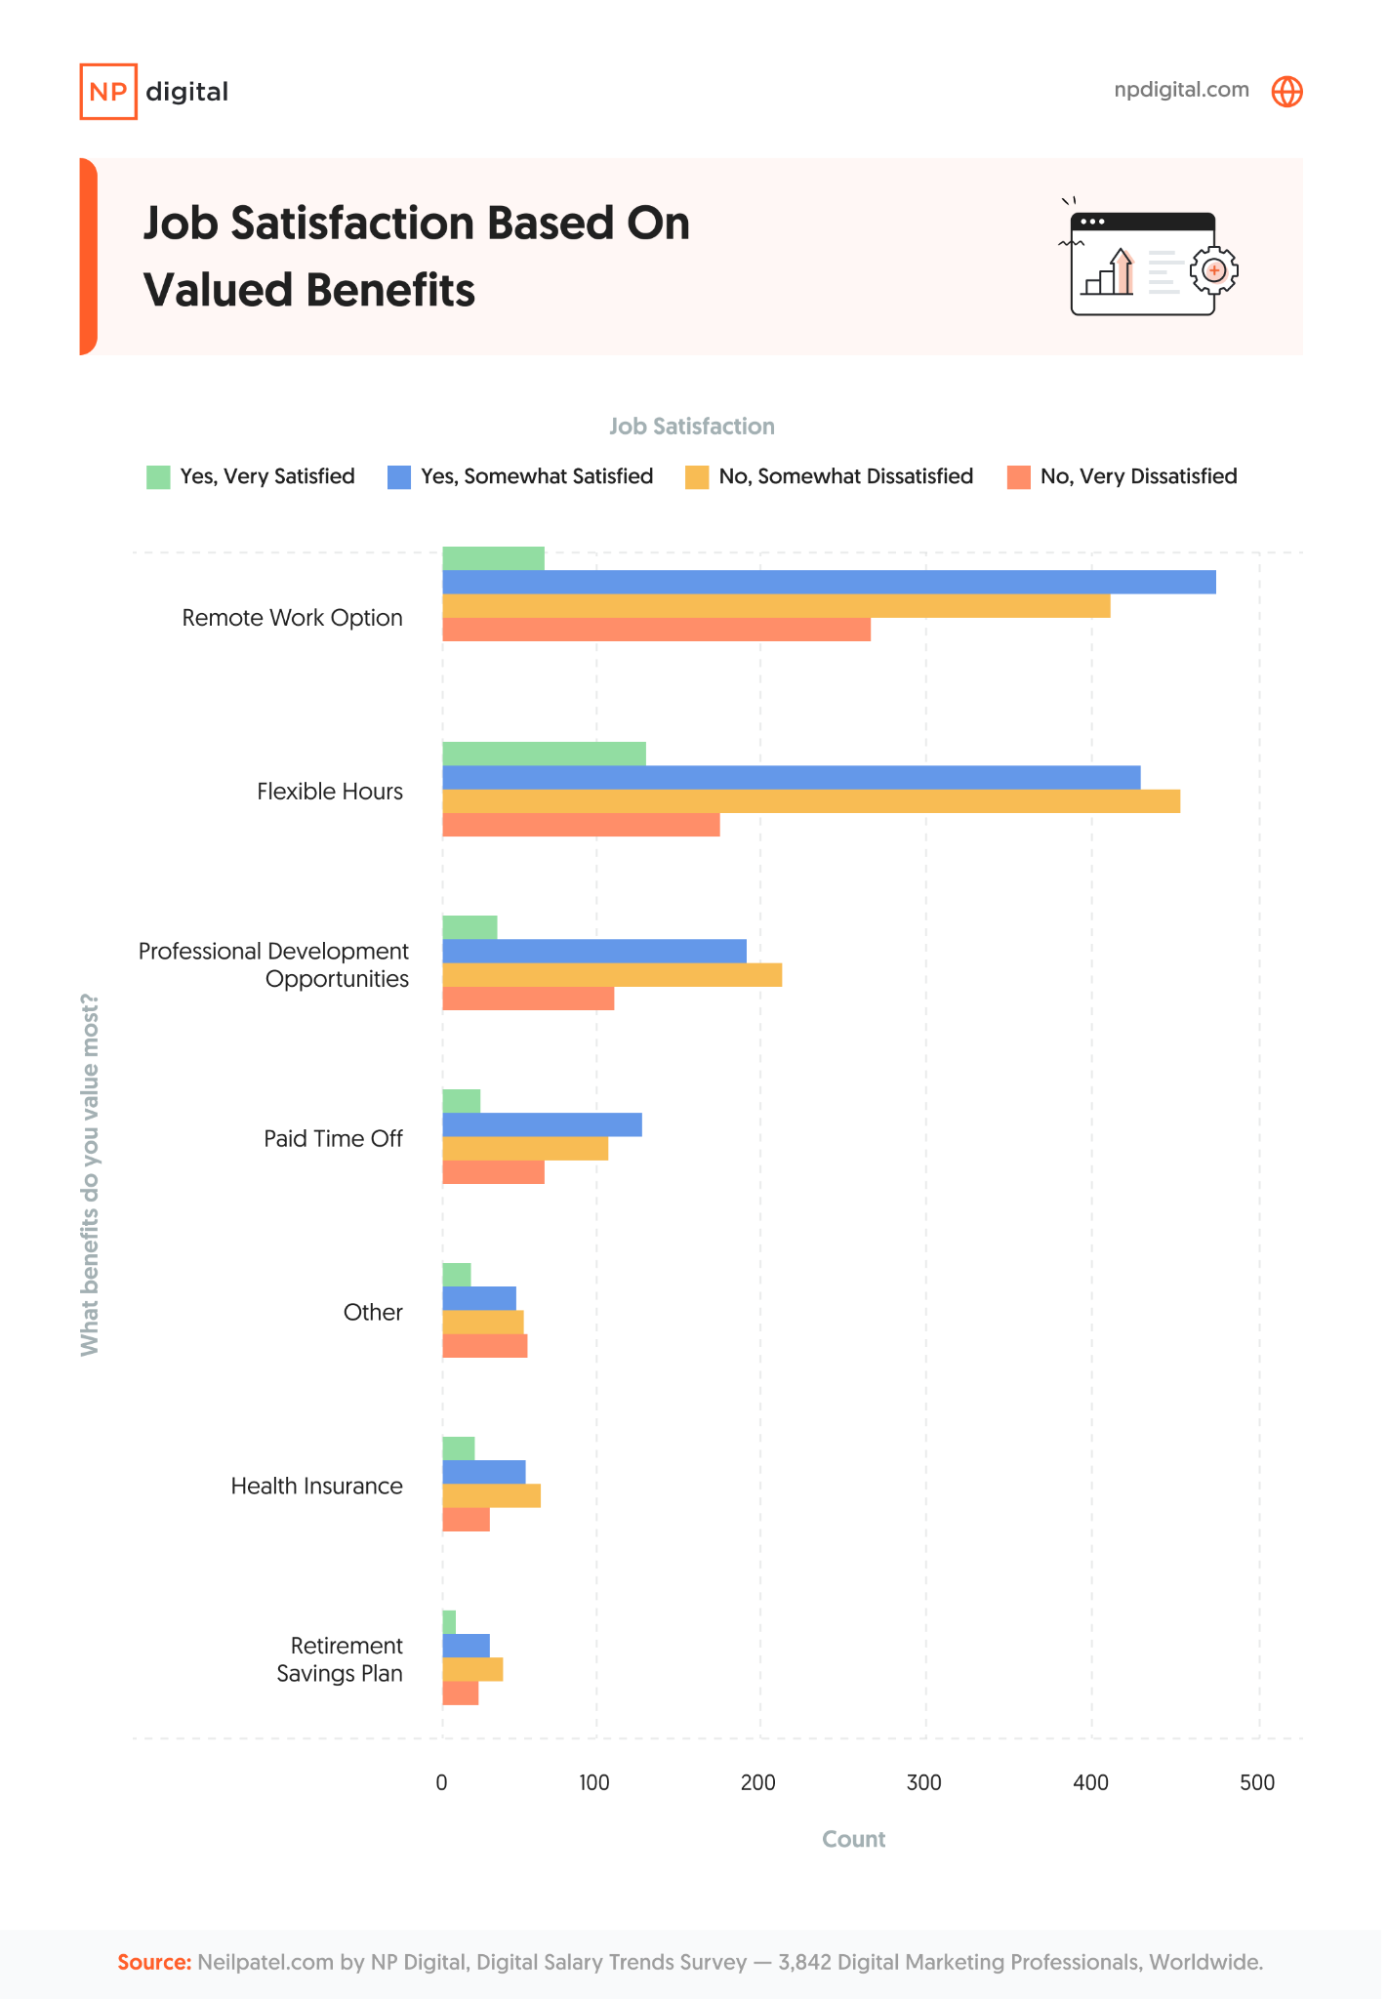
For most benefit categories, respondents who are not satisfied with their current compensation package seem to outnumber those who are satisfied. This indicates that benefits can significantly affect how happy we are in our roles.
Notably, for those who expressed dissatisfaction with their benefits packages, flexible hours and remote work were seen as the most valued benefits, suggesting that there may be some envy or interest from those still working in-person.
Health insurance is also one of the most valued benefits, even in countries like the United Kingdom, France, and Canada, which have universal healthcare.
Paid time off and retirement plans are also highly valued.
This shows that offering the right benefits to your staff can play a significant role in job satisfaction.
What Impacts Raises In Compensation?
Fifty-one percent of survey respondents said they received a raise or promotion over the past 12 months. While a raise typically leads to a more positive mindset at work, this isn’t always true. Let’s take a look in more detail.
Raises and Location
How were raises and promotions distributed across different countries?
In countries like the U.S. and the United Kingdom, many respondents received raises or promotions in the past year.
For countries like India and Brazil, there was more of an even distribution between those who received raises and promotions and those who didn’t.
Countries more likely to see raises and promotions are more likely to see better financial compensation overall.
Raises and Age
The chart below presents the distribution of raises or promotions across different age groups.
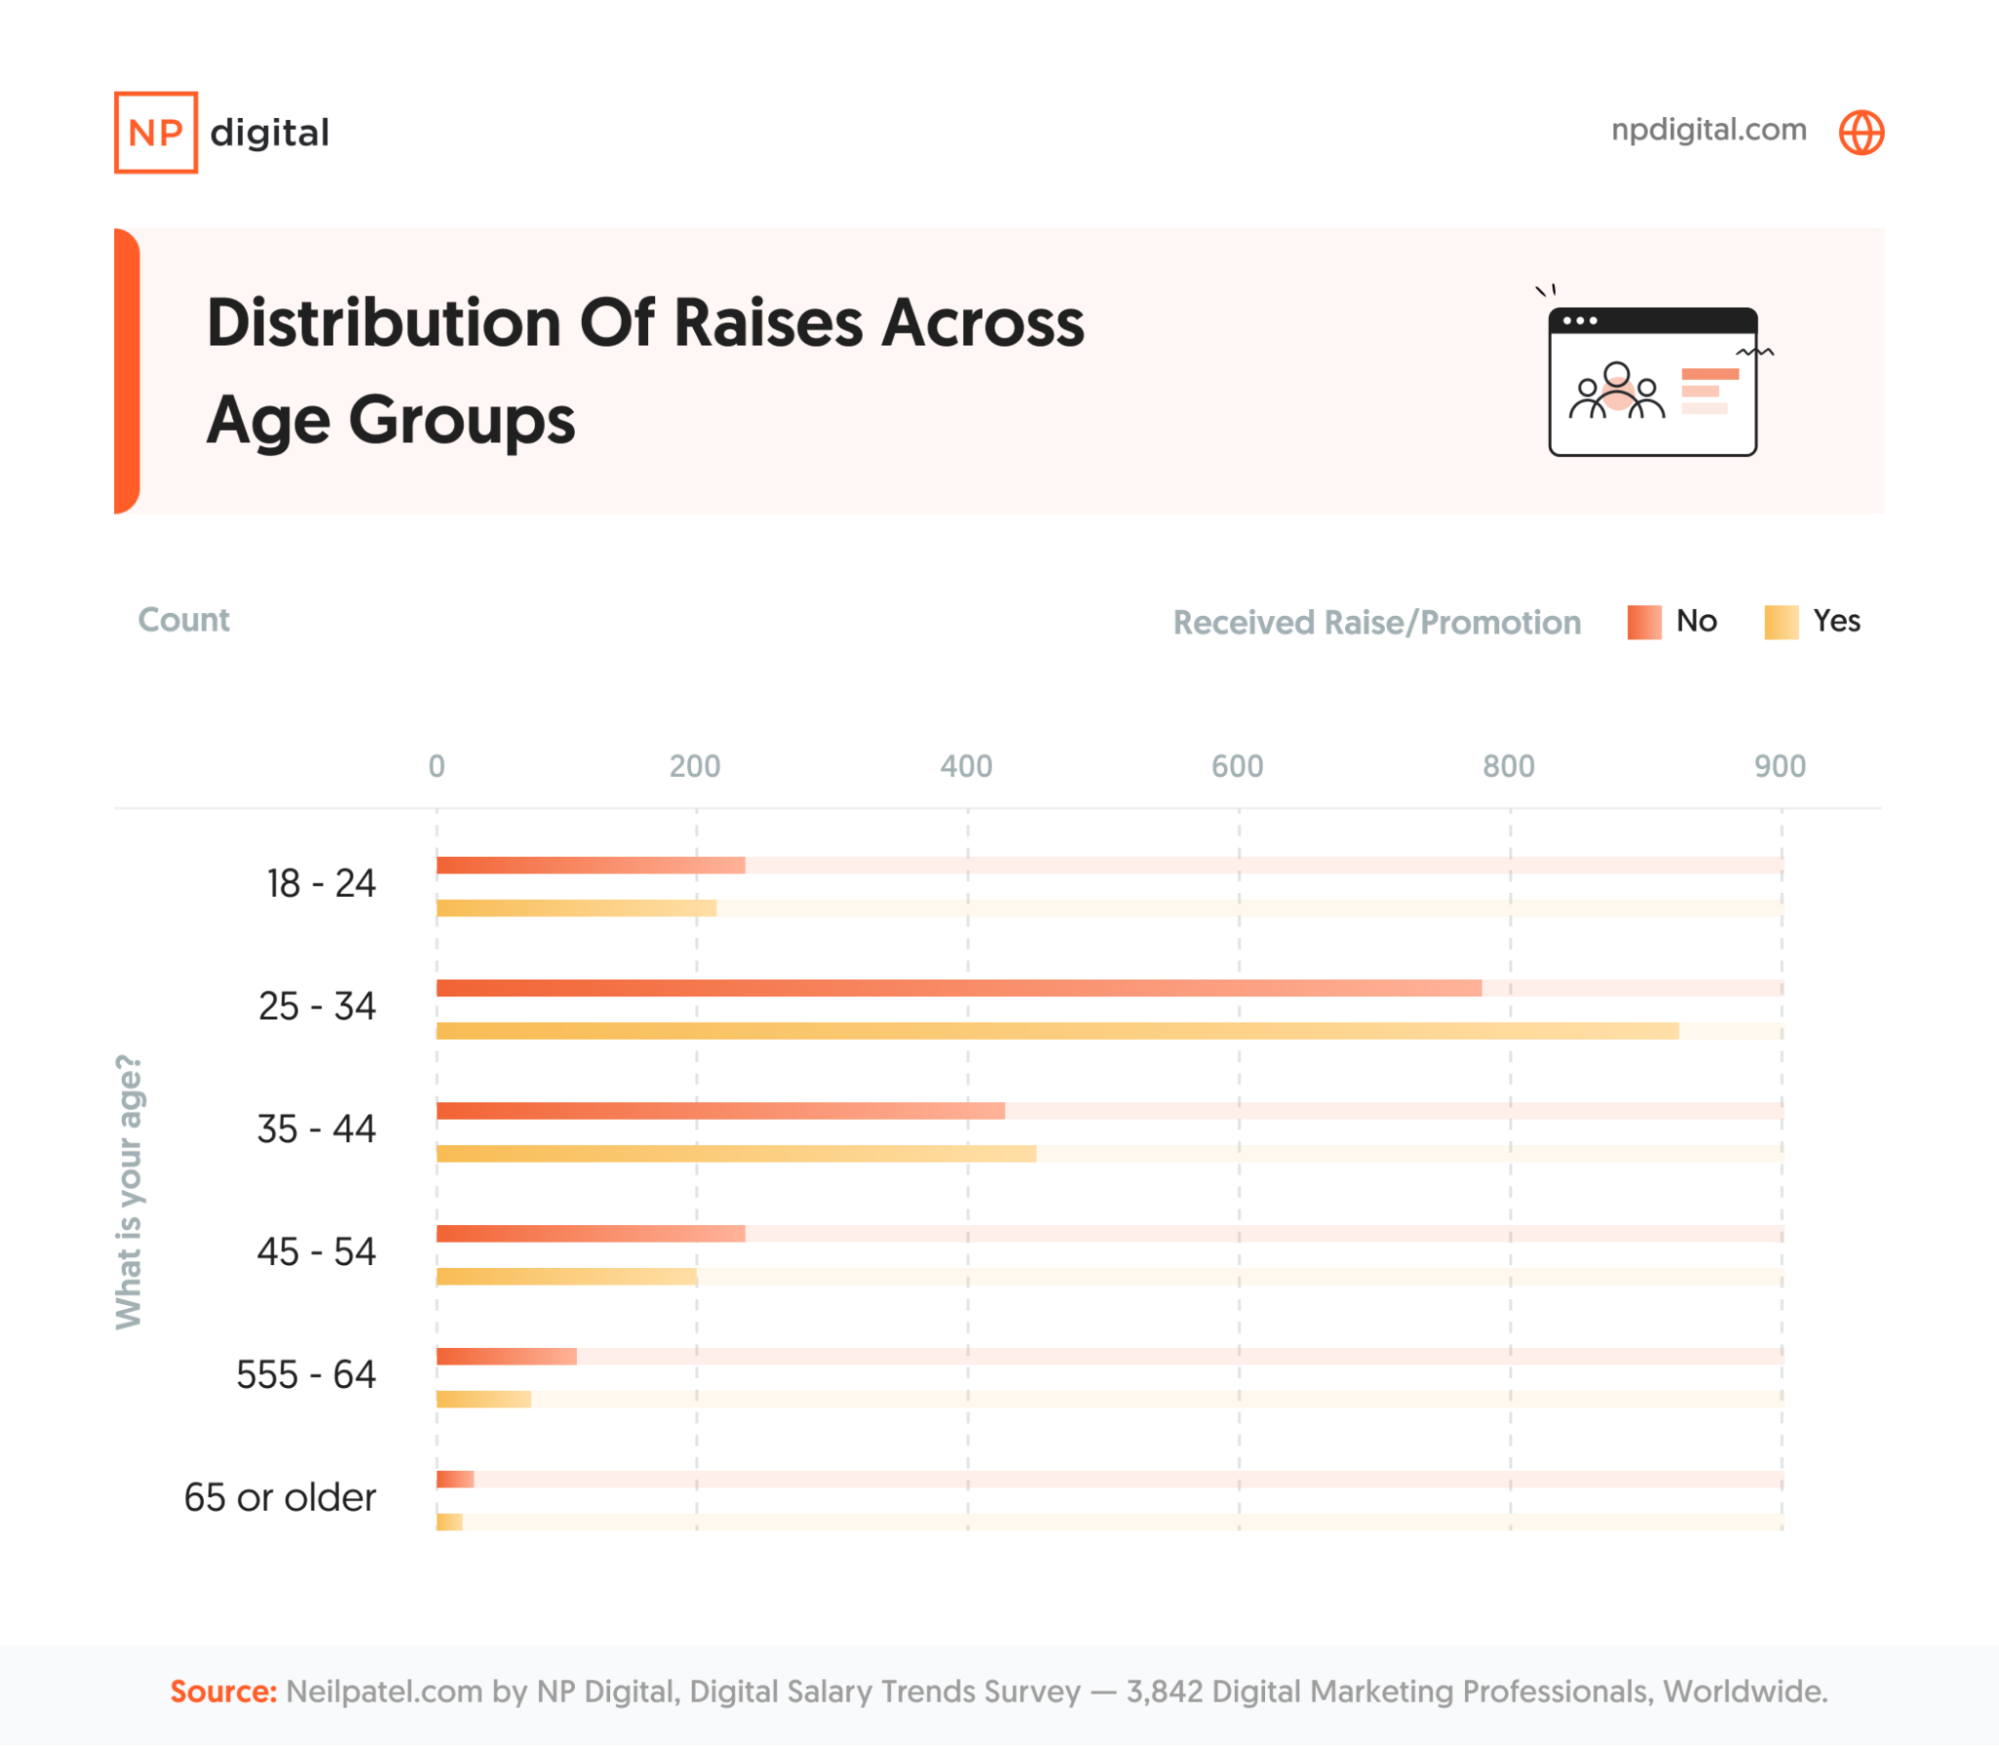
Those between the ages 25 and 34 were the most likely to receive a raise or promotion, which makes sense as many experience active career growth during these years.
Those between 35 and 44 also received many raises and promotions, possibly indicating a high amount of mid-career advancements.
Raises and promotions tapered off slightly for those in the older age groups.
Raises and Gender
There was a relatively evenly balanced number of raises and promotions between men and women over the past year, showing that gender doesn’t have a significant impact on advancement.
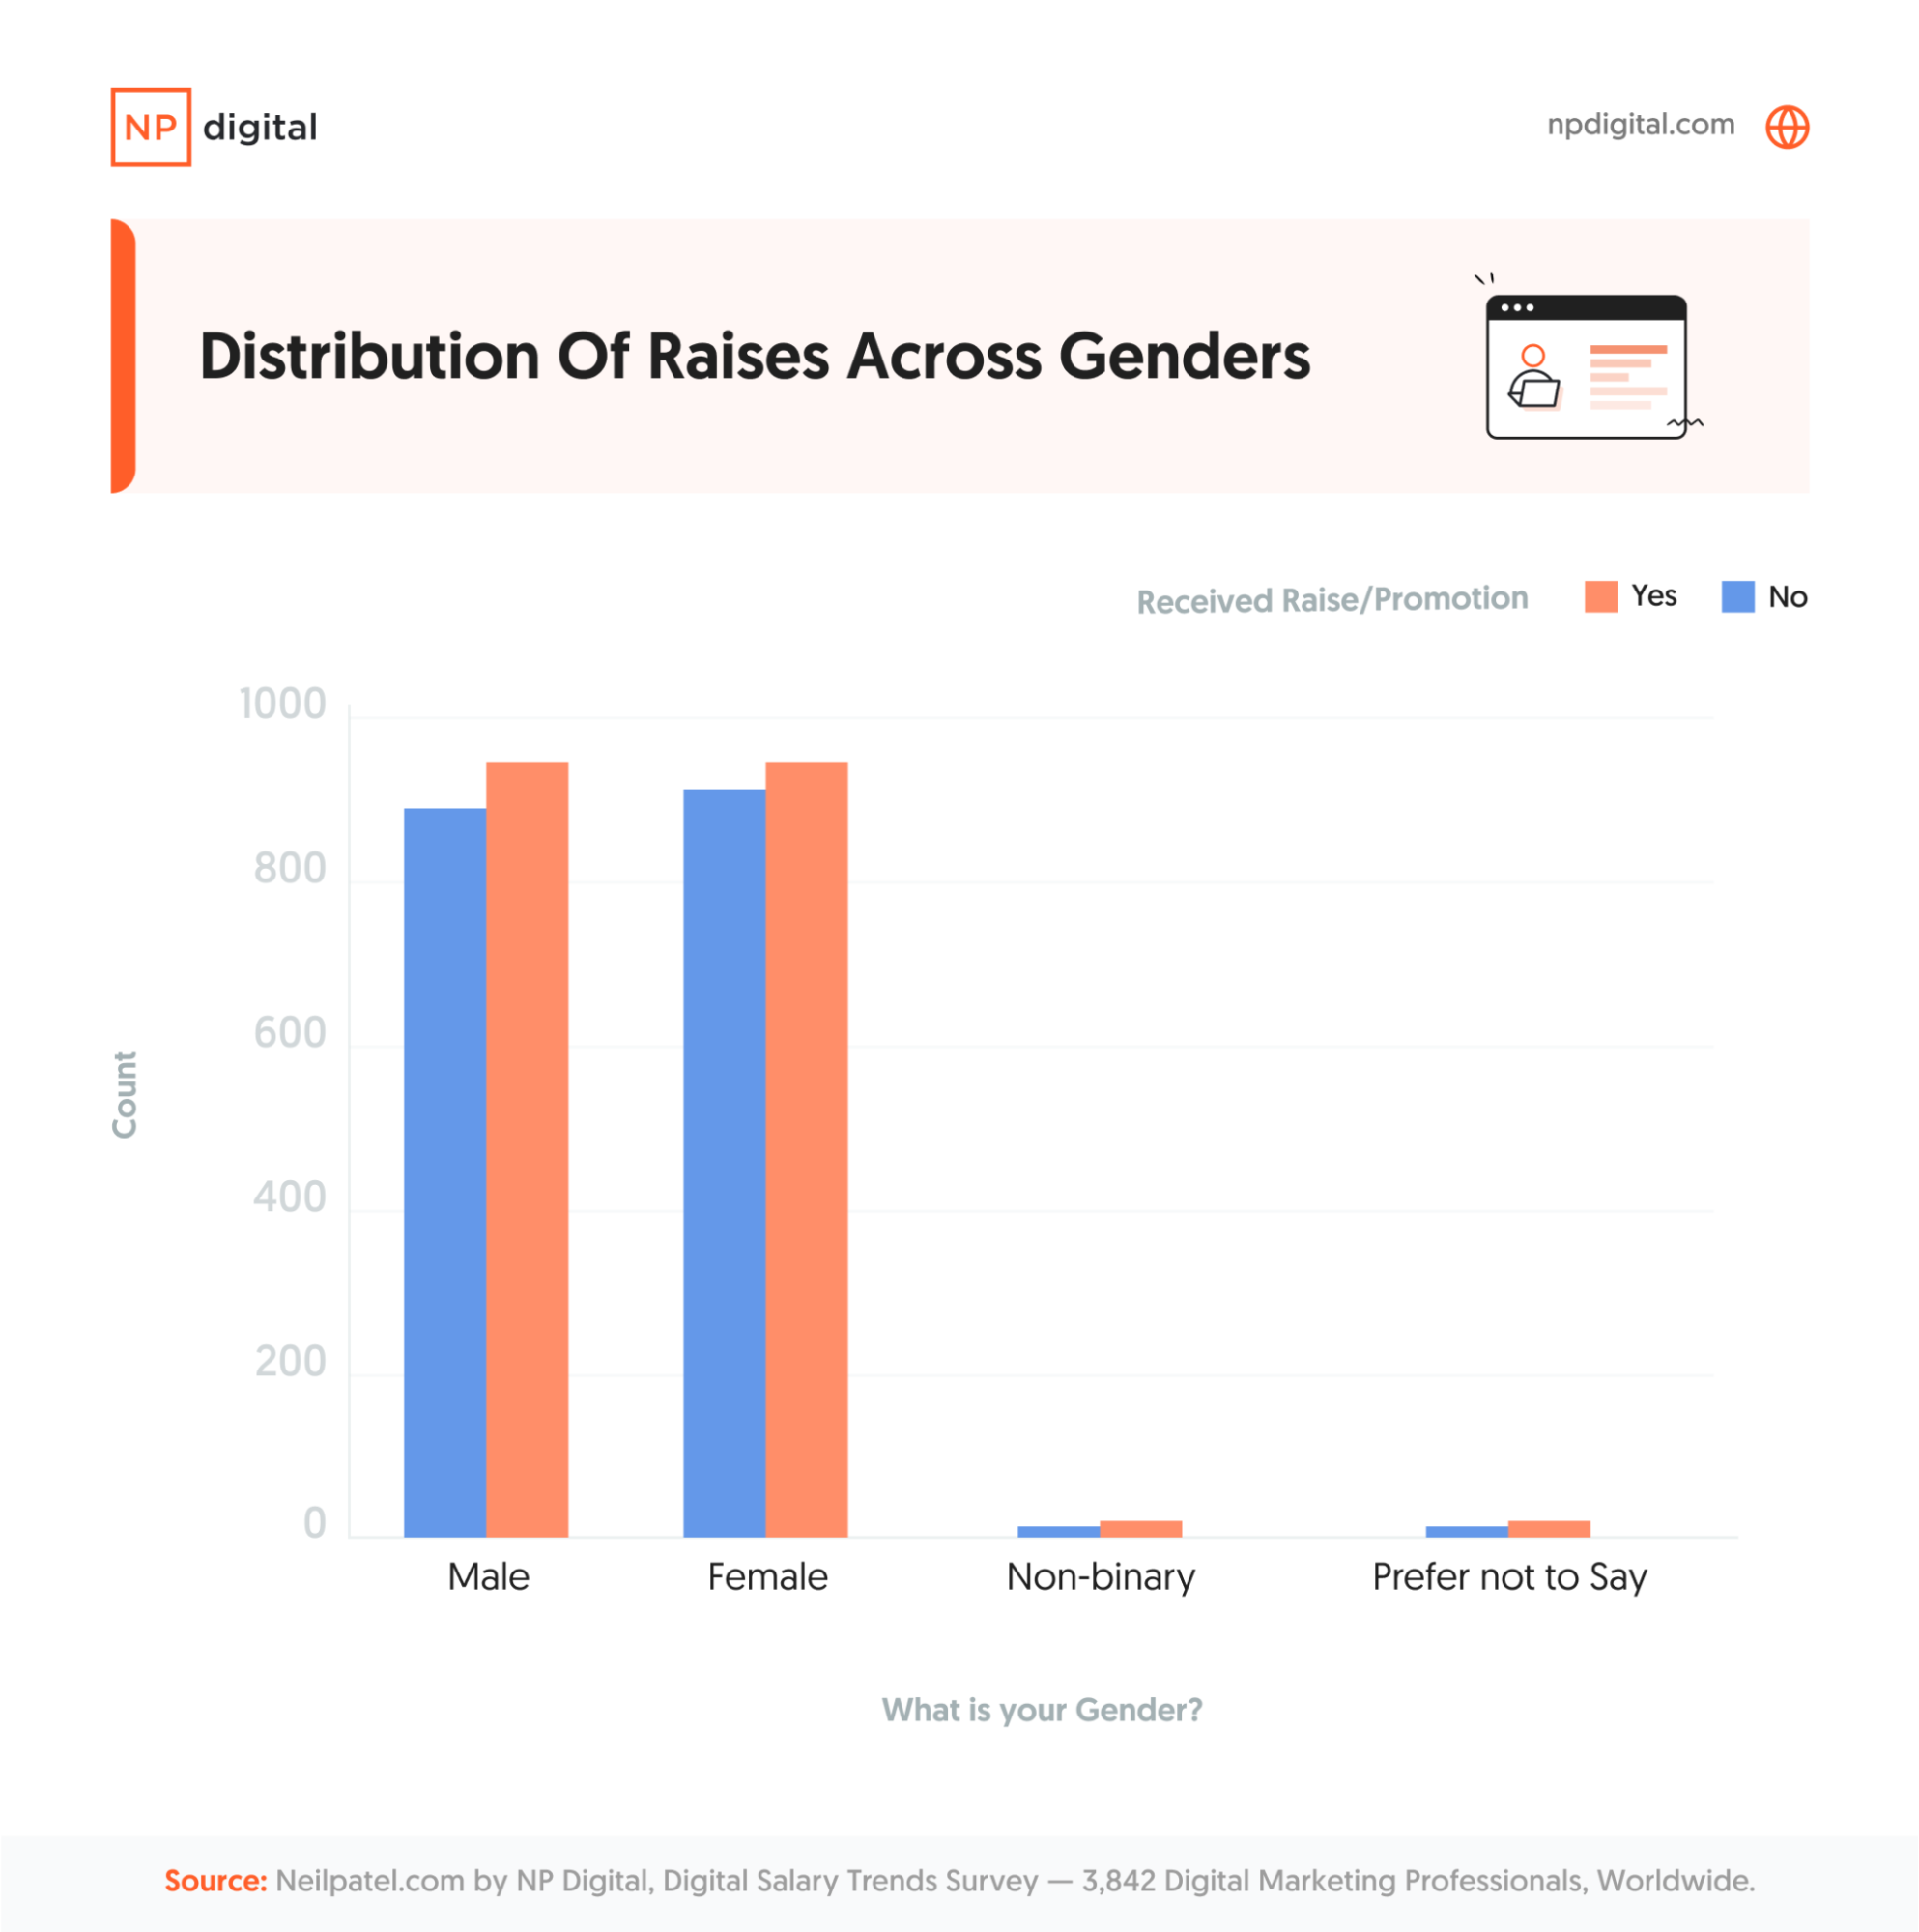
However, there is a distinct gap when it comes to gender and digital marketing salary. This implies that women aren’t financially awarded for promotions in the same way as their male counterparts.
How Raises Impact Job Satisfaction
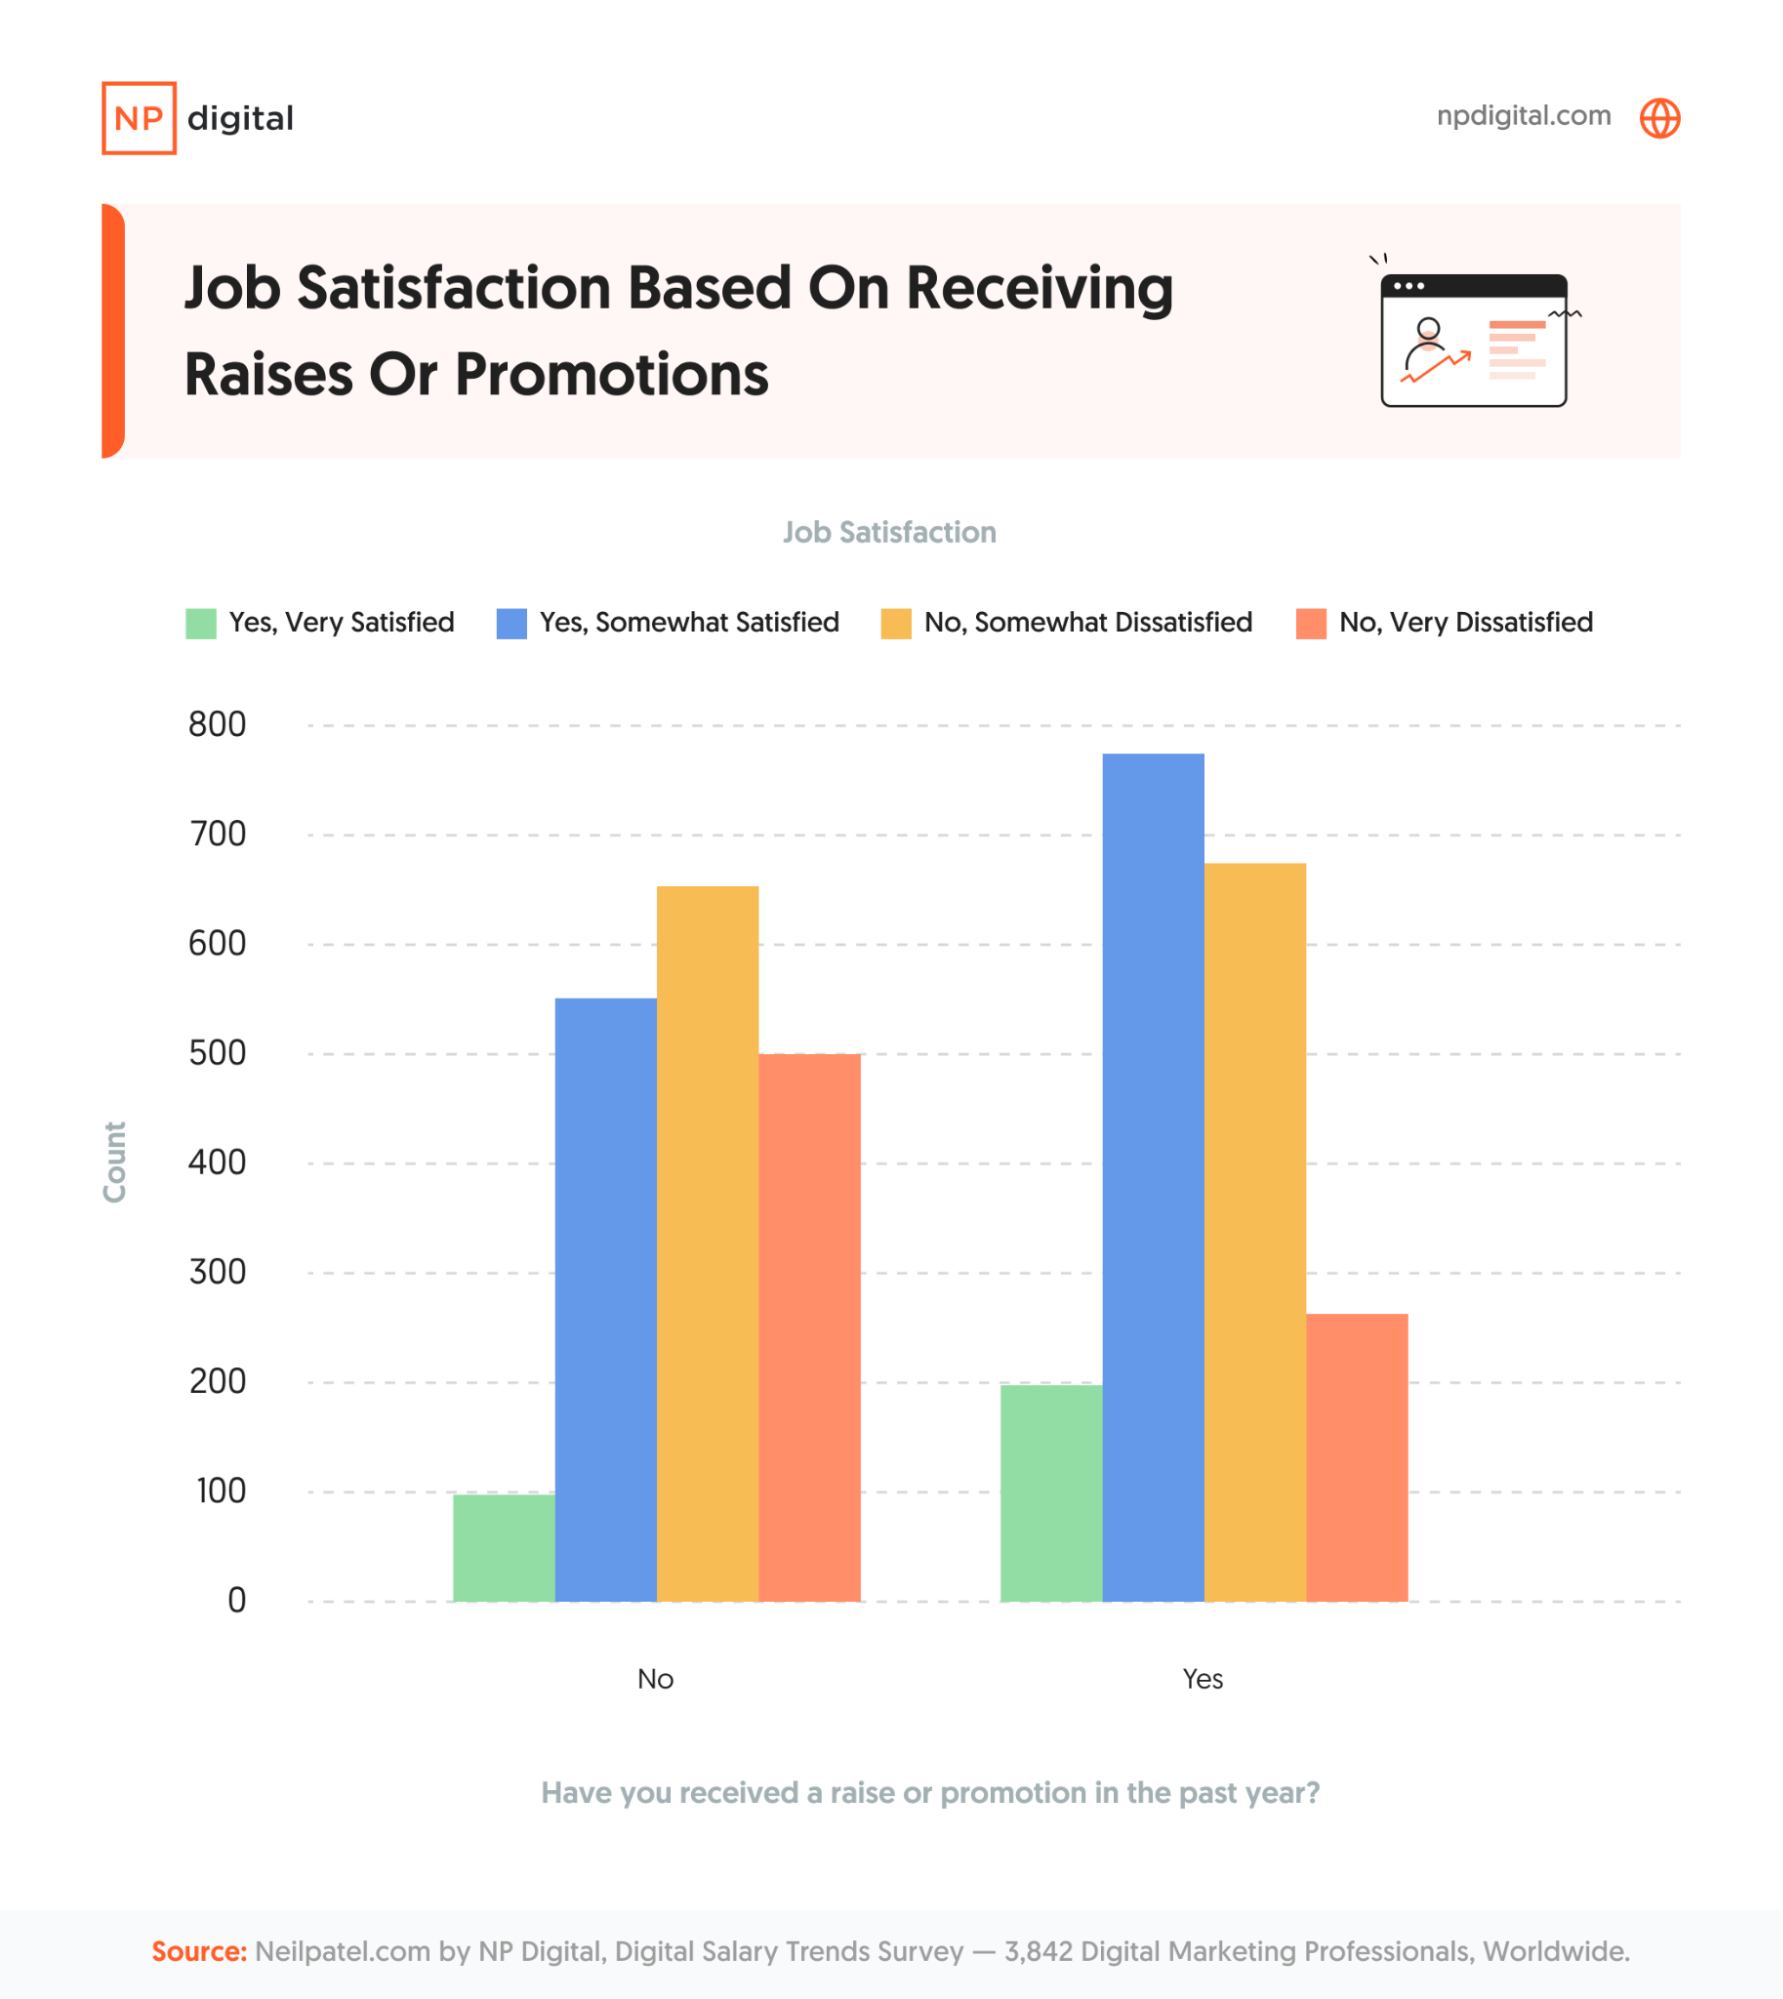
Most people who received a raise or promotion said they were somewhat or very satisfied with their compensation package. Conversely, those who didn’t receive a raise or promotion were more likely to be dissatisfied.
Why Might Digital Marketing Professionals Leave Their Jobs?
A digital marketer may leave their job for various reasons, from wanting more money to not feeling secure.
We asked respondents what key factors would make them consider leaving their current role. Here are the findings:
- For most factors like “lack of growth opportunities” and “low salary or compensation,” there are several respondents who are somewhat or very dissatisfied with their compensation package.
- “Work-life balance issues” and “seeking new challenges or more interesting work” show a more balanced distribution between satisfied and dissatisfied.
This analysis shows that people consider leaving their roles for various reasons, not just financial. Let’s drill down into the demographics to get a clearer insight.
Leaving and Age Groups
Do younger and older digital marketers consider different factors when considering leaving a role?
One item of note here is that the 25-to-34 range was the most likely to consider leaving a role. Low salary or compensation was their biggest issue, but they led the way in all categories.
Other reasons vary, depending on age. For younger people, “lack of growth opportunities” seems to be a significant reason for considering leaving. After all, young people don’t want to stay with a company if there is no scope for progression.
“Work-life balance issues” and “seeking new challenges or more interesting work” appear to be more prominent reasons among the mid-age groups. These age groups are more likely to have families and dependents. Alternatively, after a long time with a company, they may be bored and want a new challenge.
Leaving and Gender
Are men or women more likely to leave a role because of money?
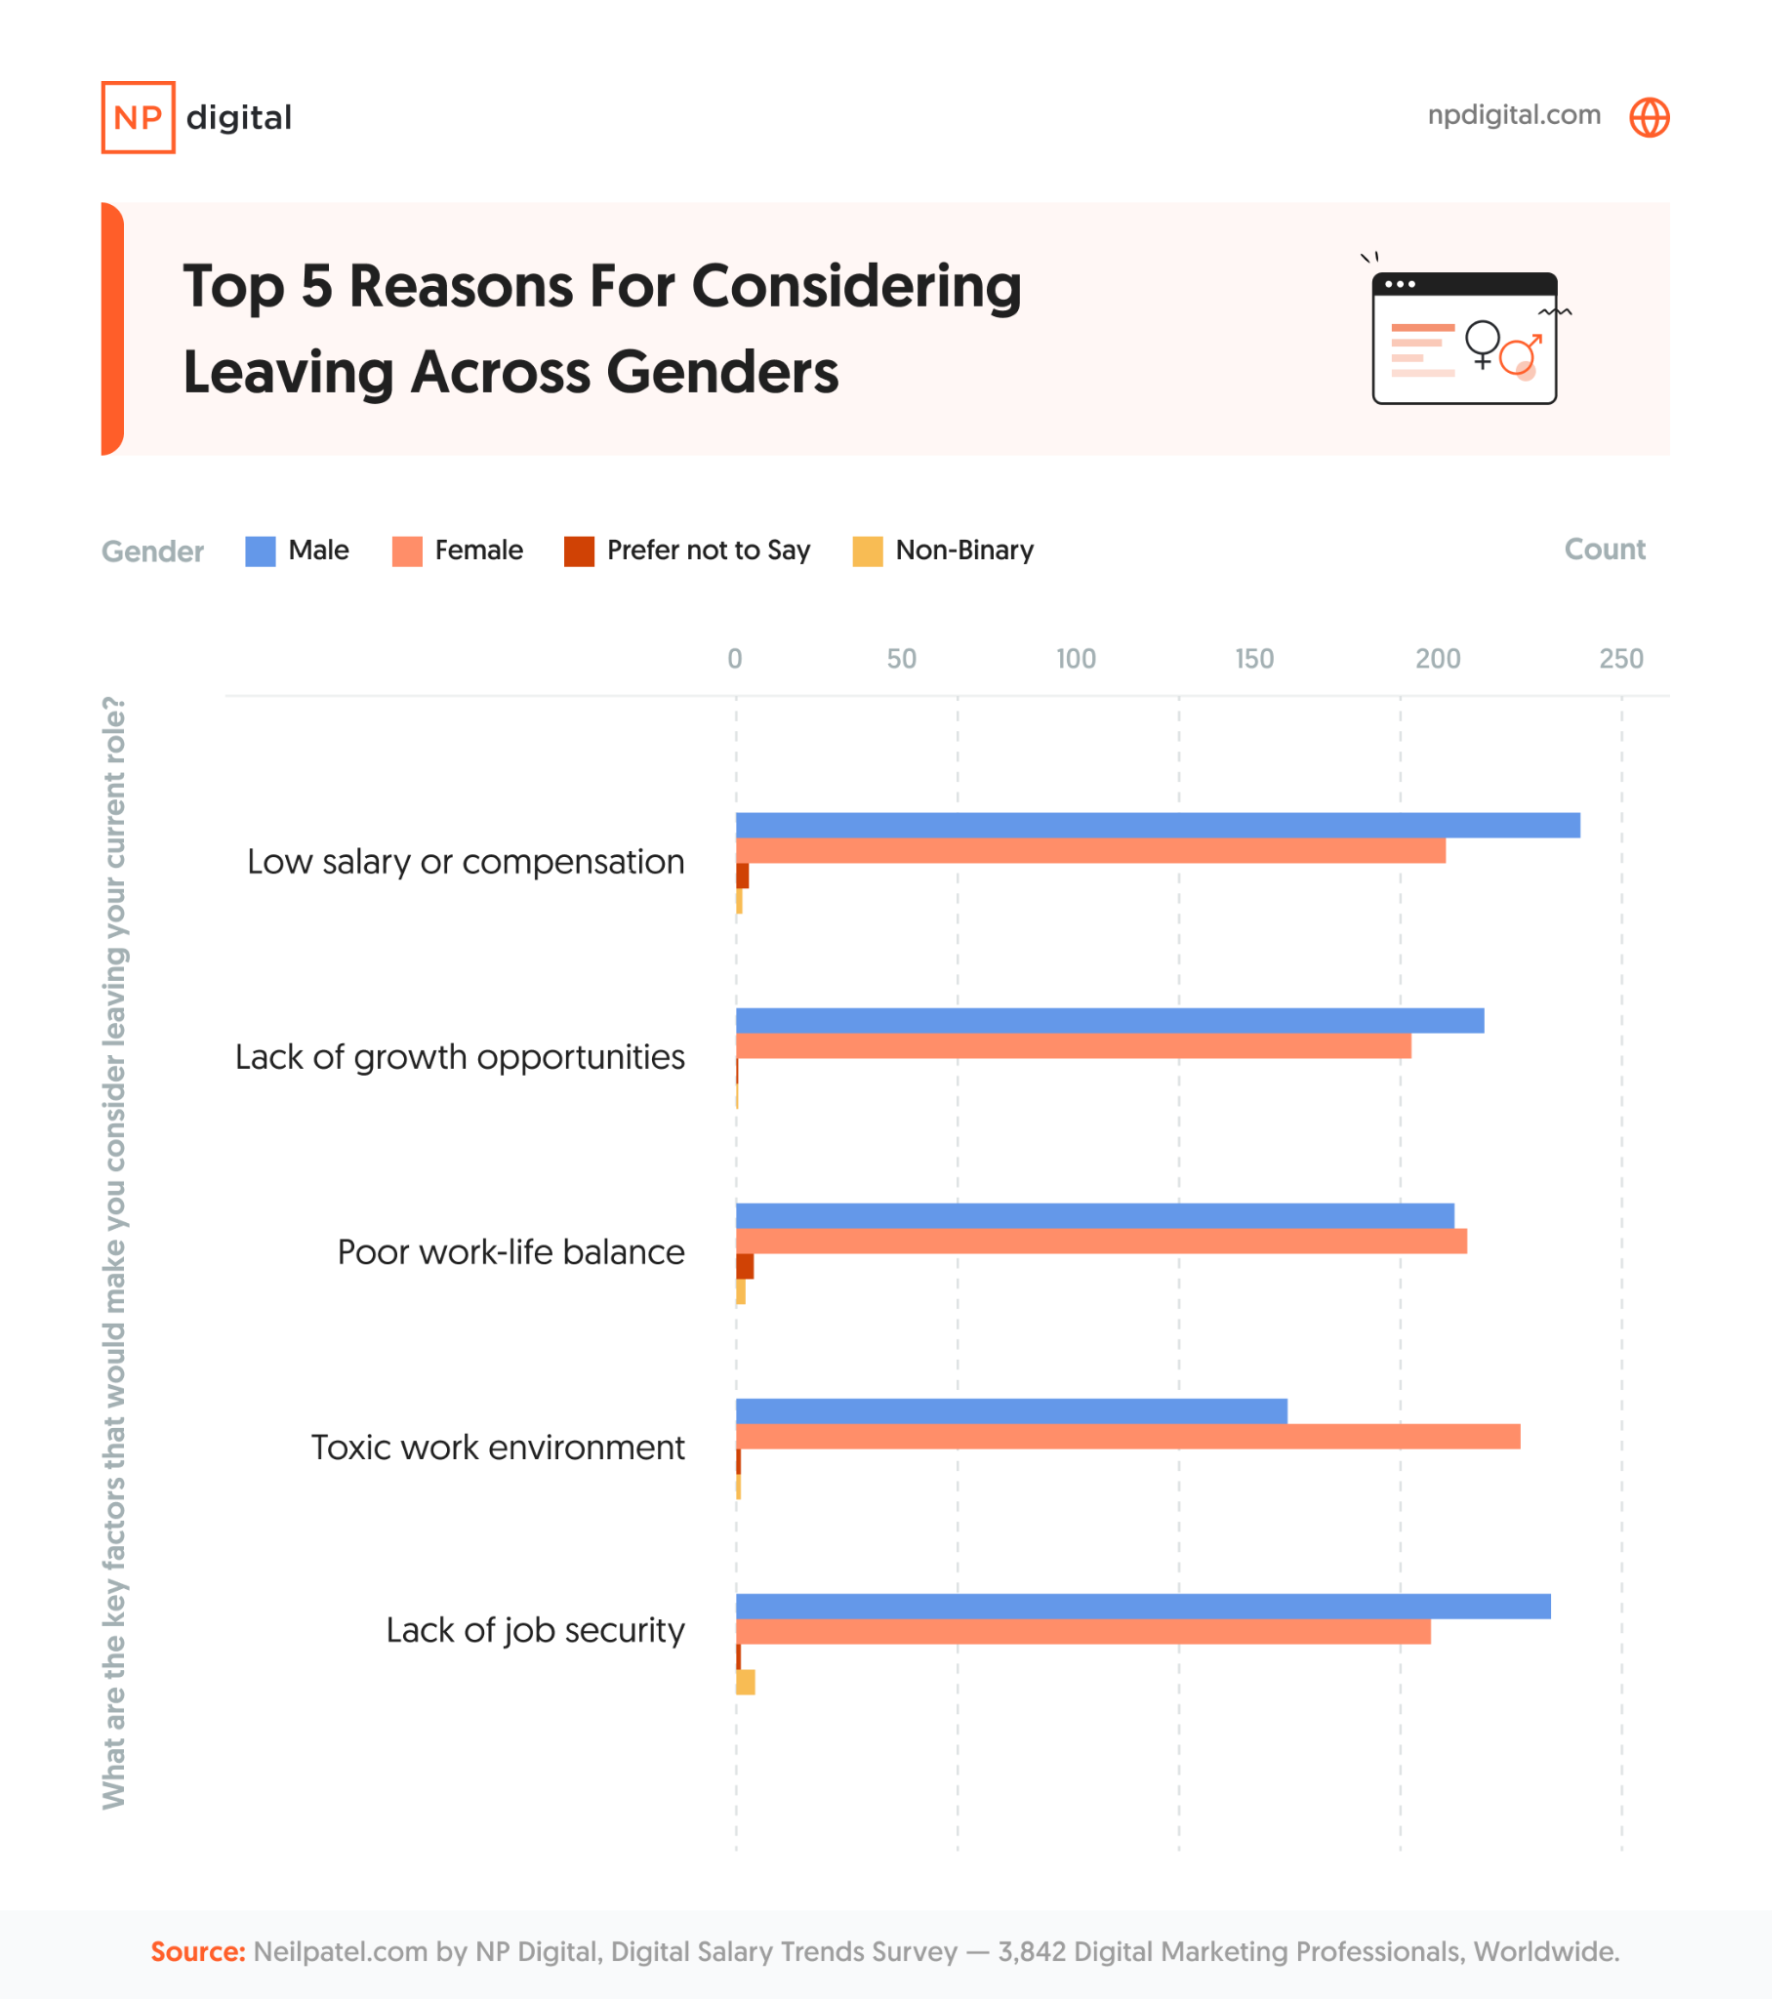
The survey results show an even distribution between genders, suggesting that men and women will willingly consider leaving a role for the same reasons.
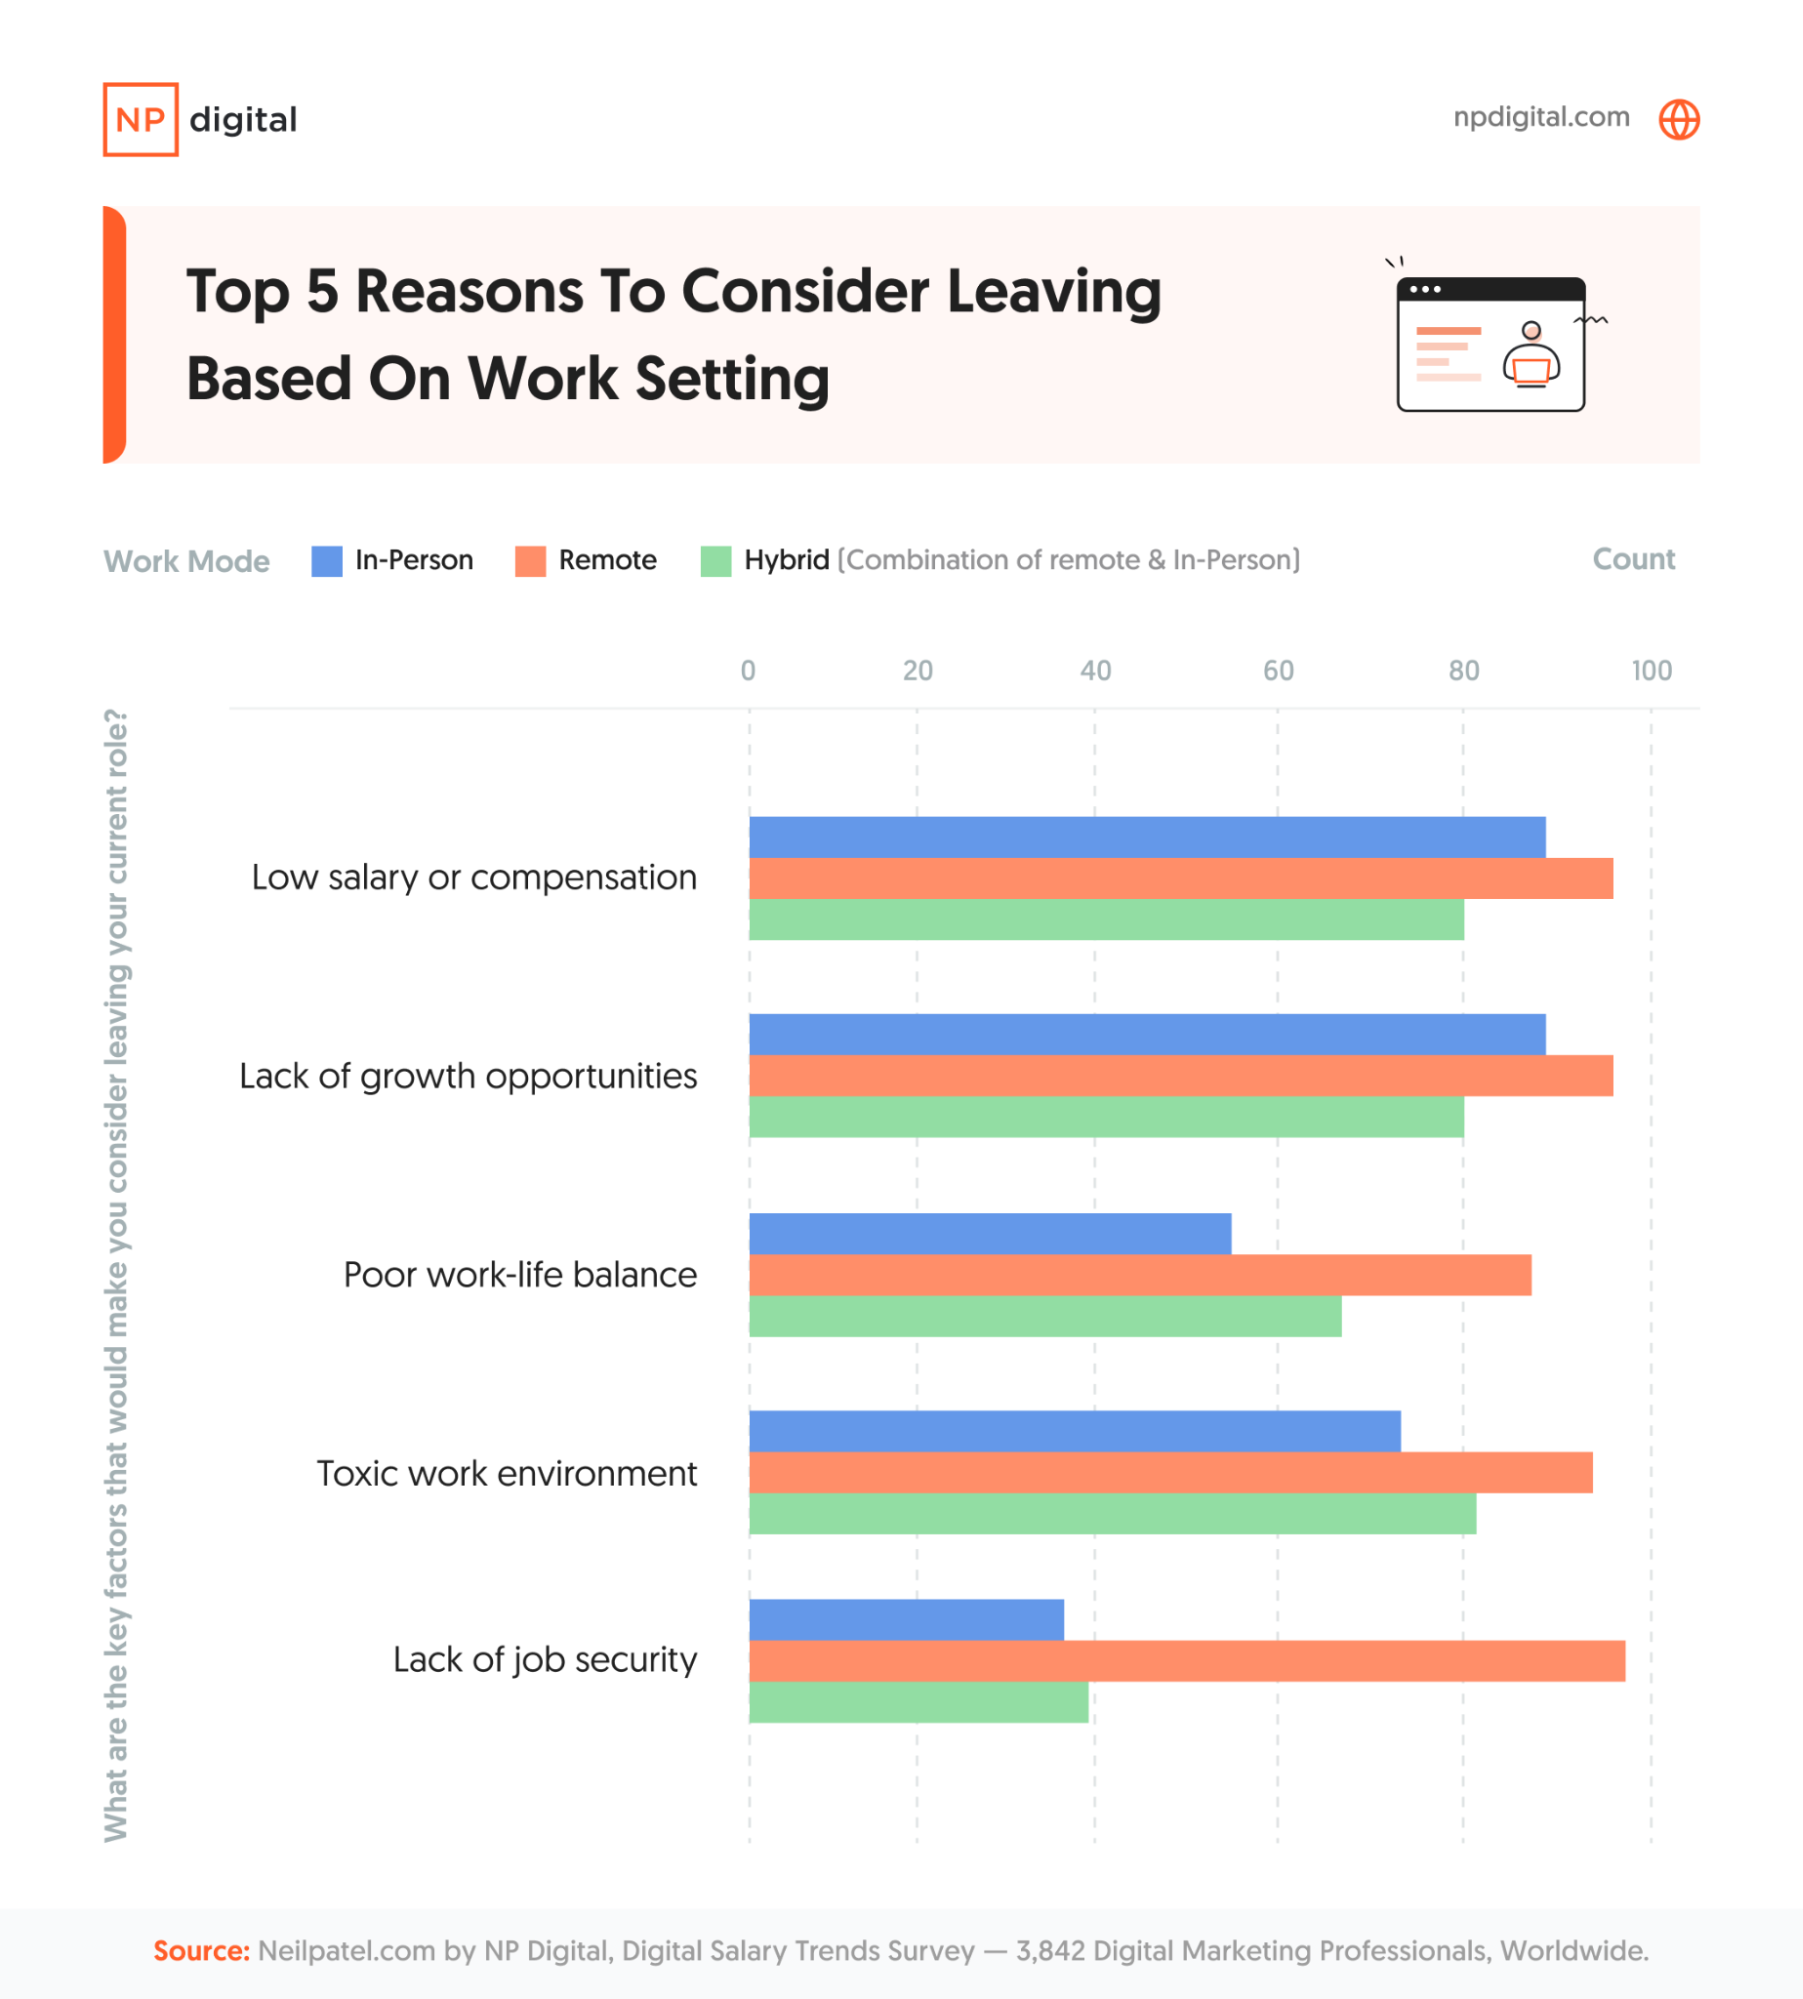
Leaving and Remote vs. In-Person Work
How we work has changed significantly over the past few years, with more people opting to work remotely. However, does remote work influence why digital marketers may think of changing jobs?

One interesting outlier here is that, for remote workers, lack of job security was a pronounced reason why they would consider leaving a role. There may be several reasons for this, perhaps because the rise of remote jobs gives them more confidence they can find another role if their current one isn’t secure.
U.S. vs. Global: Do We See Salary Differences?
This digital marketing salary trends survey received responses from all over the world, from the U.K. to South Korea.
Digital marketing experts’ salaries vary from country to country. But by how much?
This section highlights some of the most interesting comparisons between global and U.S. data.
U.S. vs. Global Salary Distribution
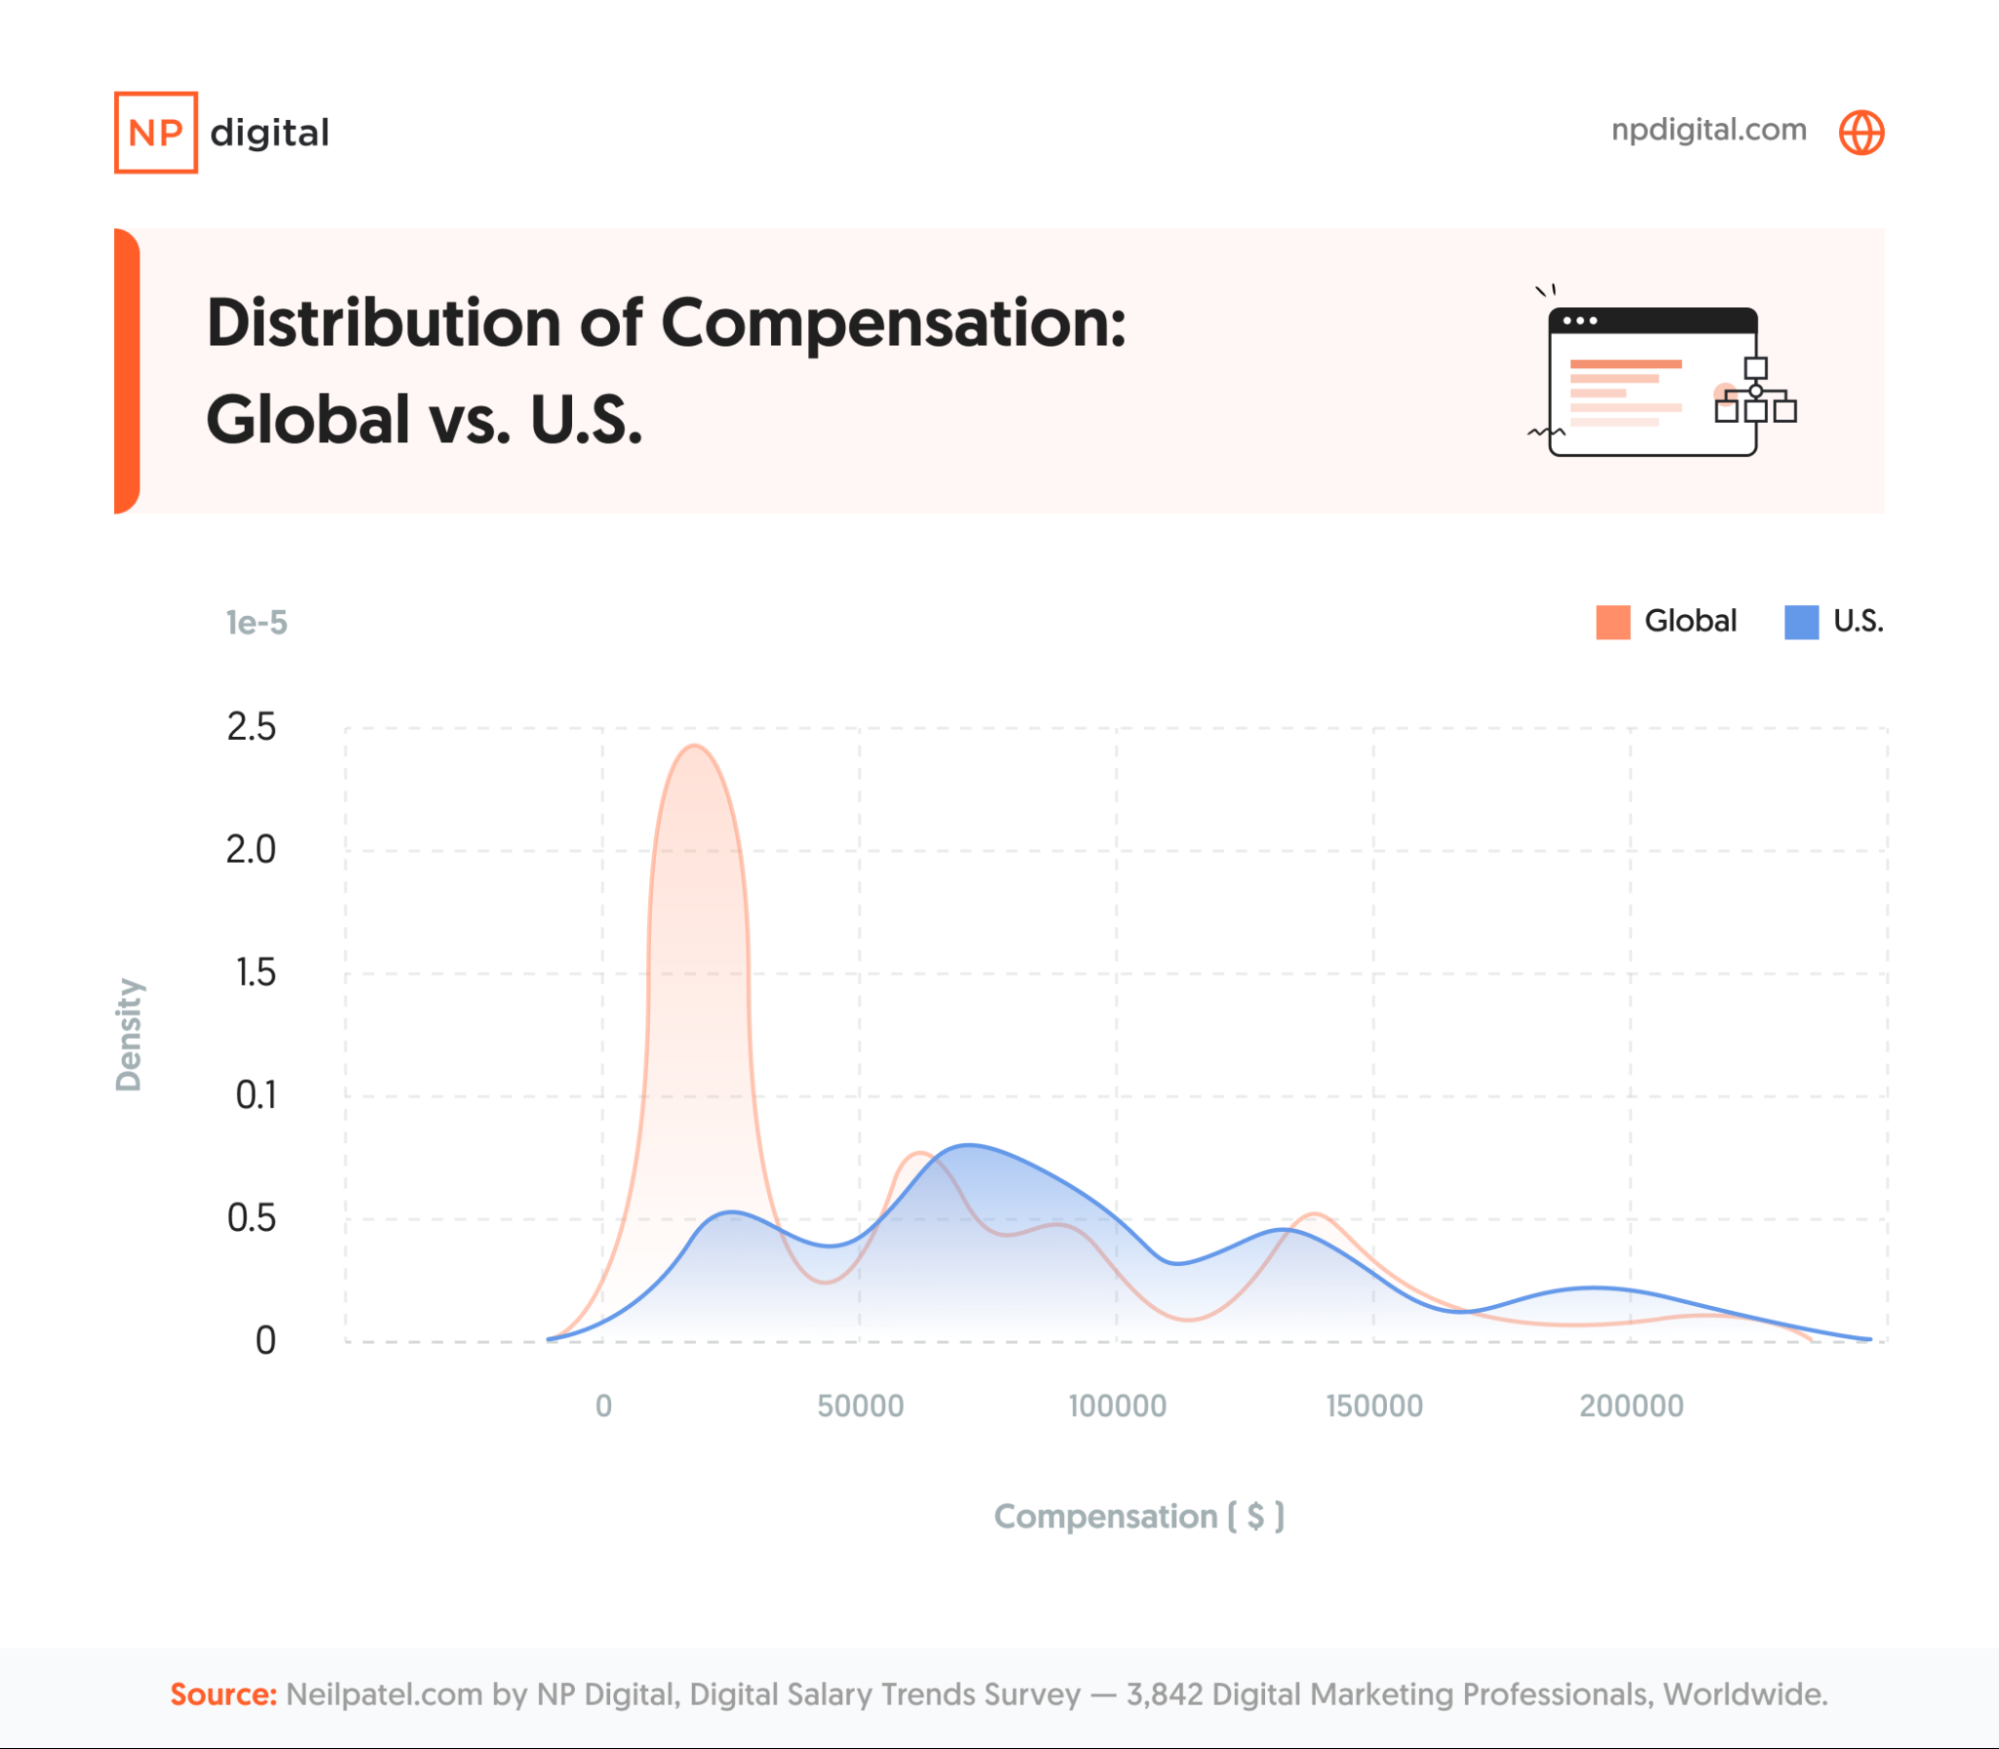
The average digital marketing salary in the U.S. is $86,931. Globally, it’s $56,326.
There’s a wider distribution of digital marketing salaries across the U.S., showing a broader range of pay scales. Conversely, a higher peak in the lower compensation bracket globally suggests that many respondents are in lower-paying positions.
Most respondents earn less than $50,000 annually in some countries like India and Brazil.
It’s important to note that the U.S. has a high demand for digital marketing skills and is home to many tech companies, which can result in bigger digital marketing salaries.
U.S. vs. Global Salary Progression
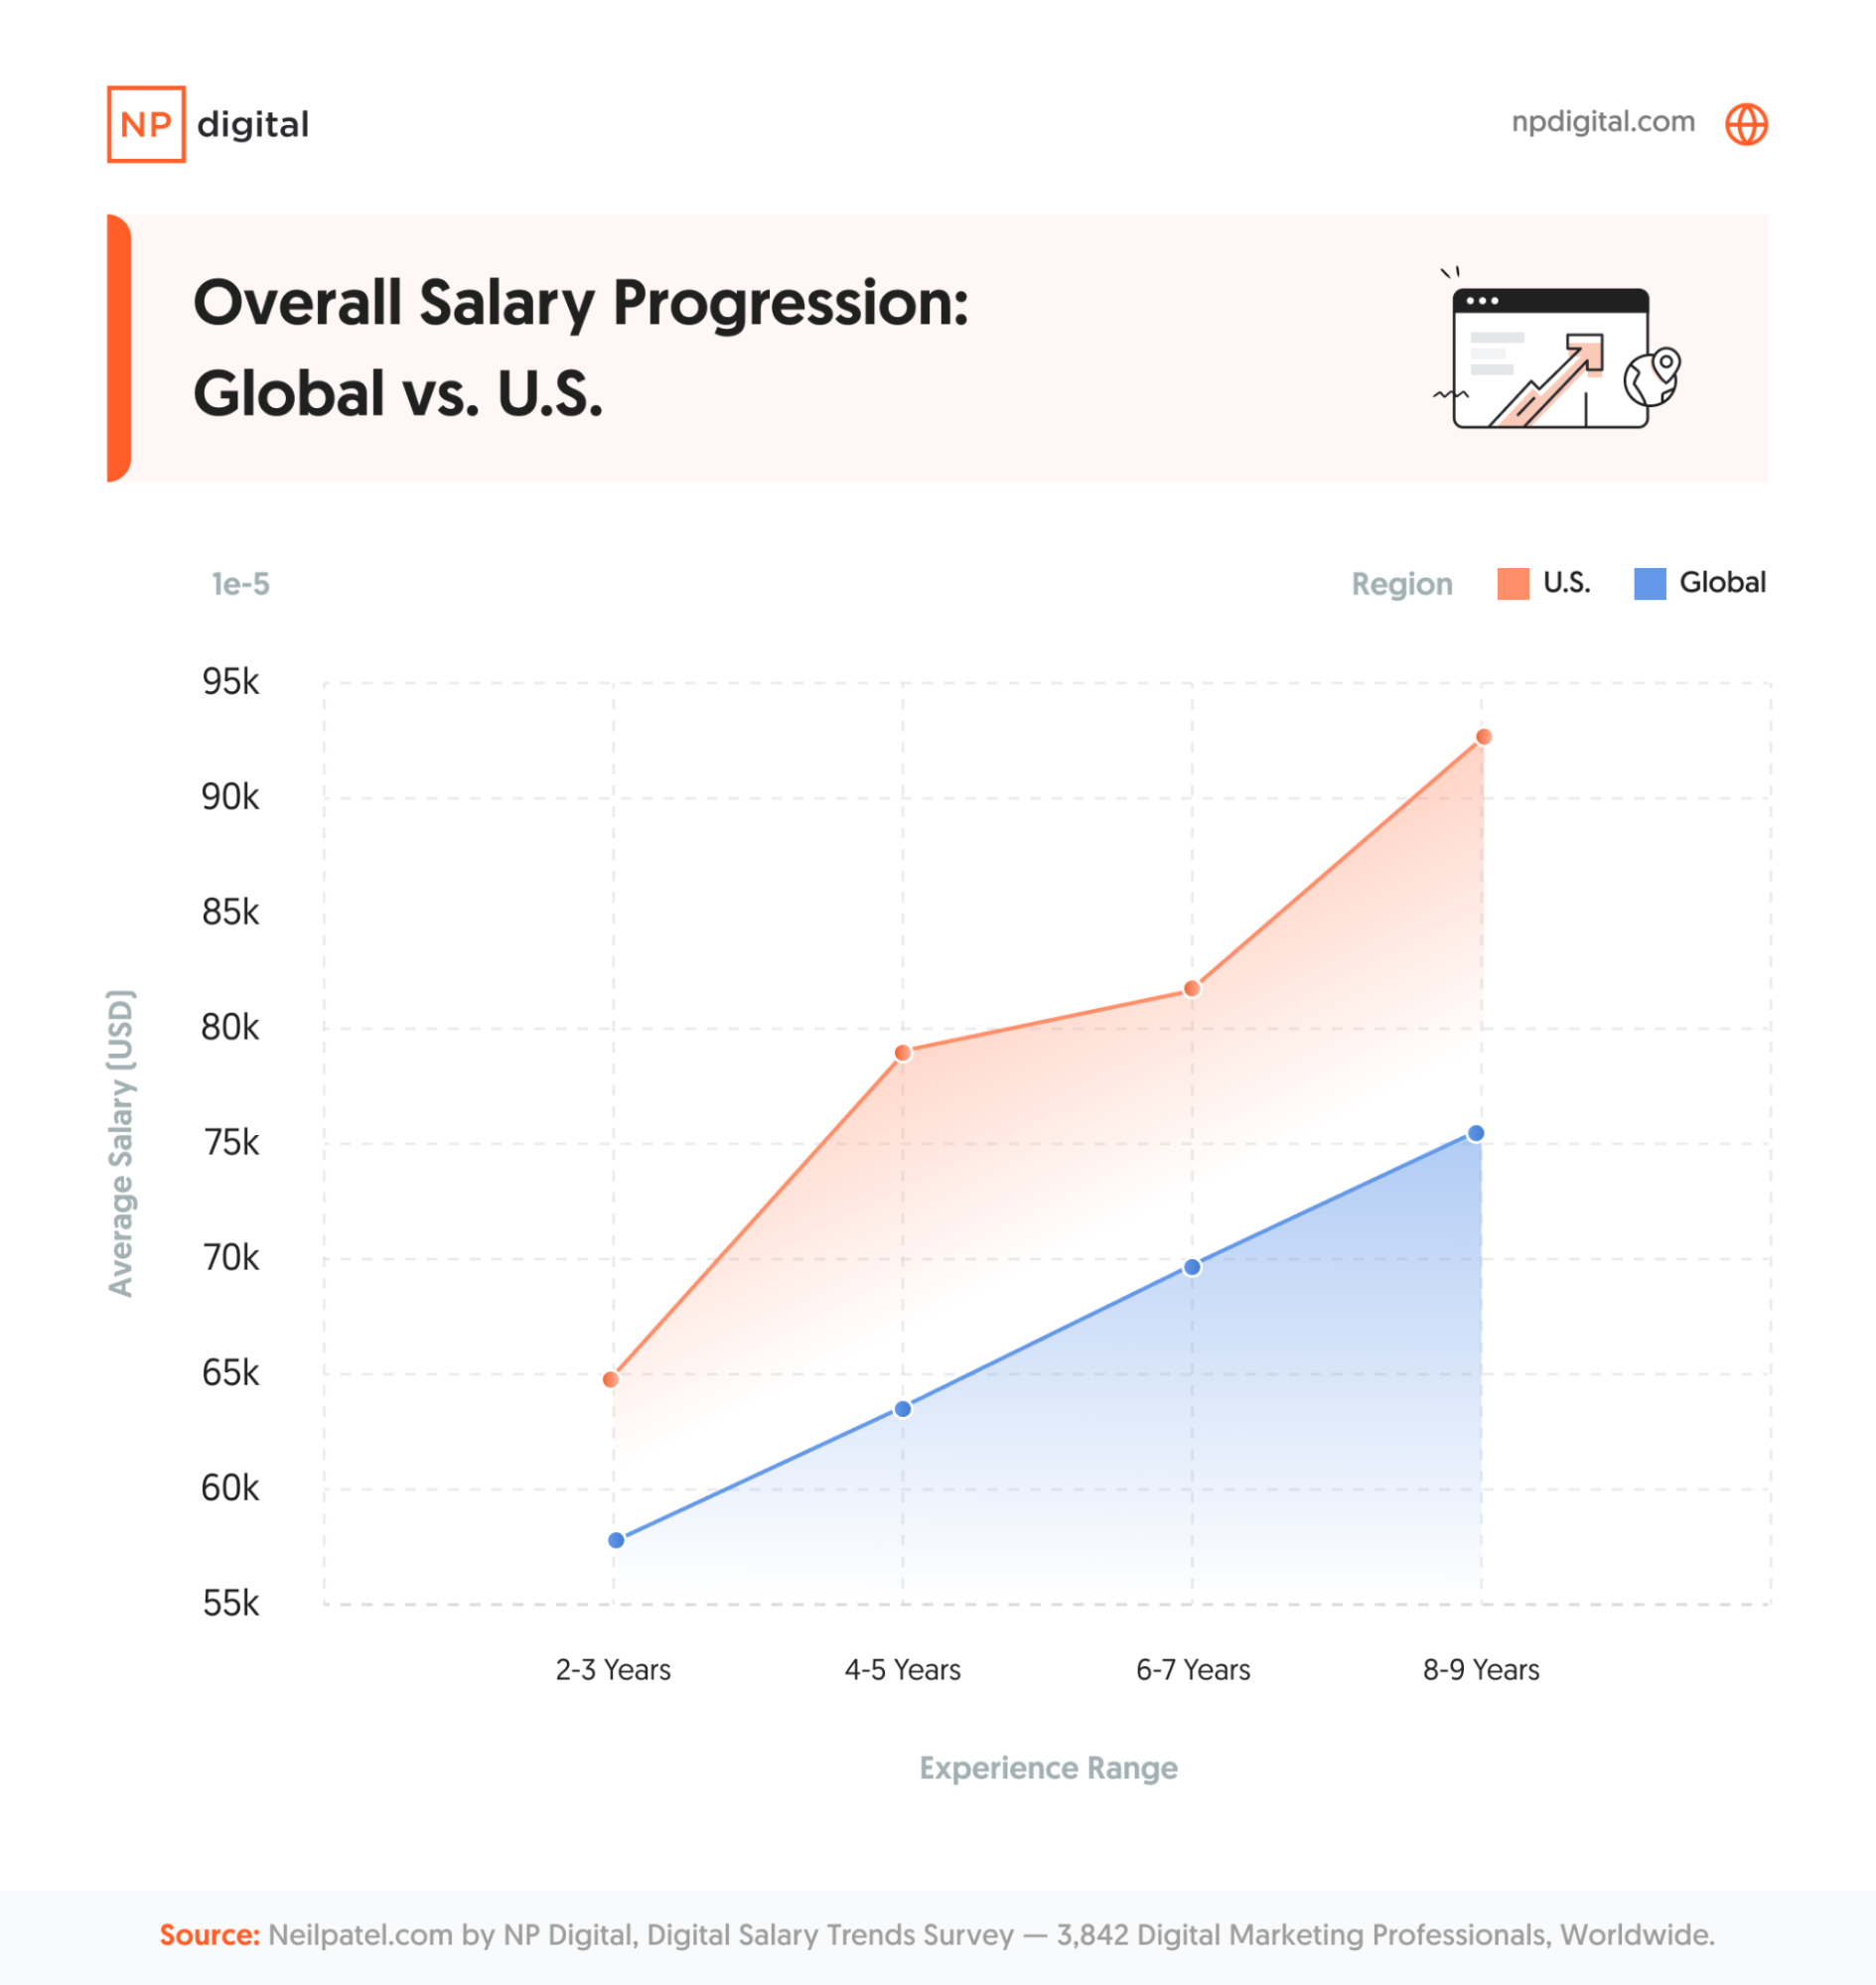
How do digital marketing salaries progress in the U.S. and globally? Let’s split the typical digital marketing career into three stages.
In the first stage of an early digital marketing career, there isn’t a pronounced difference between global and U.S. averages.
However, the gap starts to become more noticeable mid-career, with U.S. salaries sharply increasing as digital marketers become more experienced and skilled.
In the final stage, there’s a substantial difference between global and U.S. averages, reflecting the potential premium for highly experienced digital marketing professionals in the U.S.
As an added note here, the global average salary in USD for those with less than 2 years of experience was $49,000, compared to $51,923 in the U.S. Above 10 years of experience, the average salary was $75,137 globally compared to $100,227 in the U.S.
U.S. vs. Global: Why People Leave Their Jobs
Different countries have different working cultures, and this is reflected in the reasons why people consider leaving their digital marketing roles.
For example, “low salary or compensation” and lack of growth opportunities” are key reasons for leaving the U.S., suggesting that salary is important to digital marketers there.
In India, “lack of growth opportunities” is the main reason for leaving, showing that people in India are more likely to value high status and prestige.
In the United Kingdom, while people will leave their jobs because of low salaries, the other reason they consider leaving is “seeking new challenges or more interesting work.” The U.K. landscape is becoming more driven by science, technology, engineering, and math (STEM), the green economy, and the creative industries, meaning people may dream of working in more exciting sectors.
What Can Leaders at Digital Marketing Companies Learn From Our Findings?
If you manage a digital marketing team, how can you help your employees become more satisfied?
While people are motivated by salary, the findings of this survey show that people are also driven by a range of other benefits and perks.
Here are some actionable steps:
- Your employees don’t have to work in the same country as your business. Location discrepancy can lead to more satisfied staff.
- Review the benefits you offer your employees. Flexible working hours and remote work can lead to a happier team.
- Reward staff for a job well done. Raises and promotions can drastically boost job satisfaction.
- Encourage transparency in the workplace—it’s OK for employees to talk about their salaries.
- Invest in professional development to help build your employees’ digital marketing careers.
- Speak to your team and ask how you can help them be happier at work. While the results of this survey can guide you, everyone has unique needs and desires.
FAQs
How much do digital marketers make?
The average digital marketer salary in the U.S. is $86,931, while the average compensation globally is $56,326.
How much can a digital marketer make?
Just over 2 percent of respondents to our survey said they make over $200,000.
However, it’s also essential to consider the importance of non-financial benefits, including flexible hours, health insurance, remote working, and professional development opportunities.
What impacts how much you can make in marketing?
The salary for digital marketing can vary depending on several factors:
- Your seniority level
- The years of experience you have
- The industry you work in
- Whether you work in-house or for an agency
- The size of the company you work for
- The country you work in
Conclusion
We hope this survey provided valuable feedback about digital marketing salary trends worldwide.
If you operate a digital marketing business, how can you create an effective compensation package for nurturing top talent and encouraging fantastic new hires? It’s all about knowing what your employees value most. Take the time to ask for feedback to guide your strategy moving forward.
This will help create a stellar company culture that keeps employees happy. And happy employees lead to satisfied customers.
What do you think about the results of this salary trends survey? Are the findings in line with your experiences in the digital marketing industry?
Our Methodology
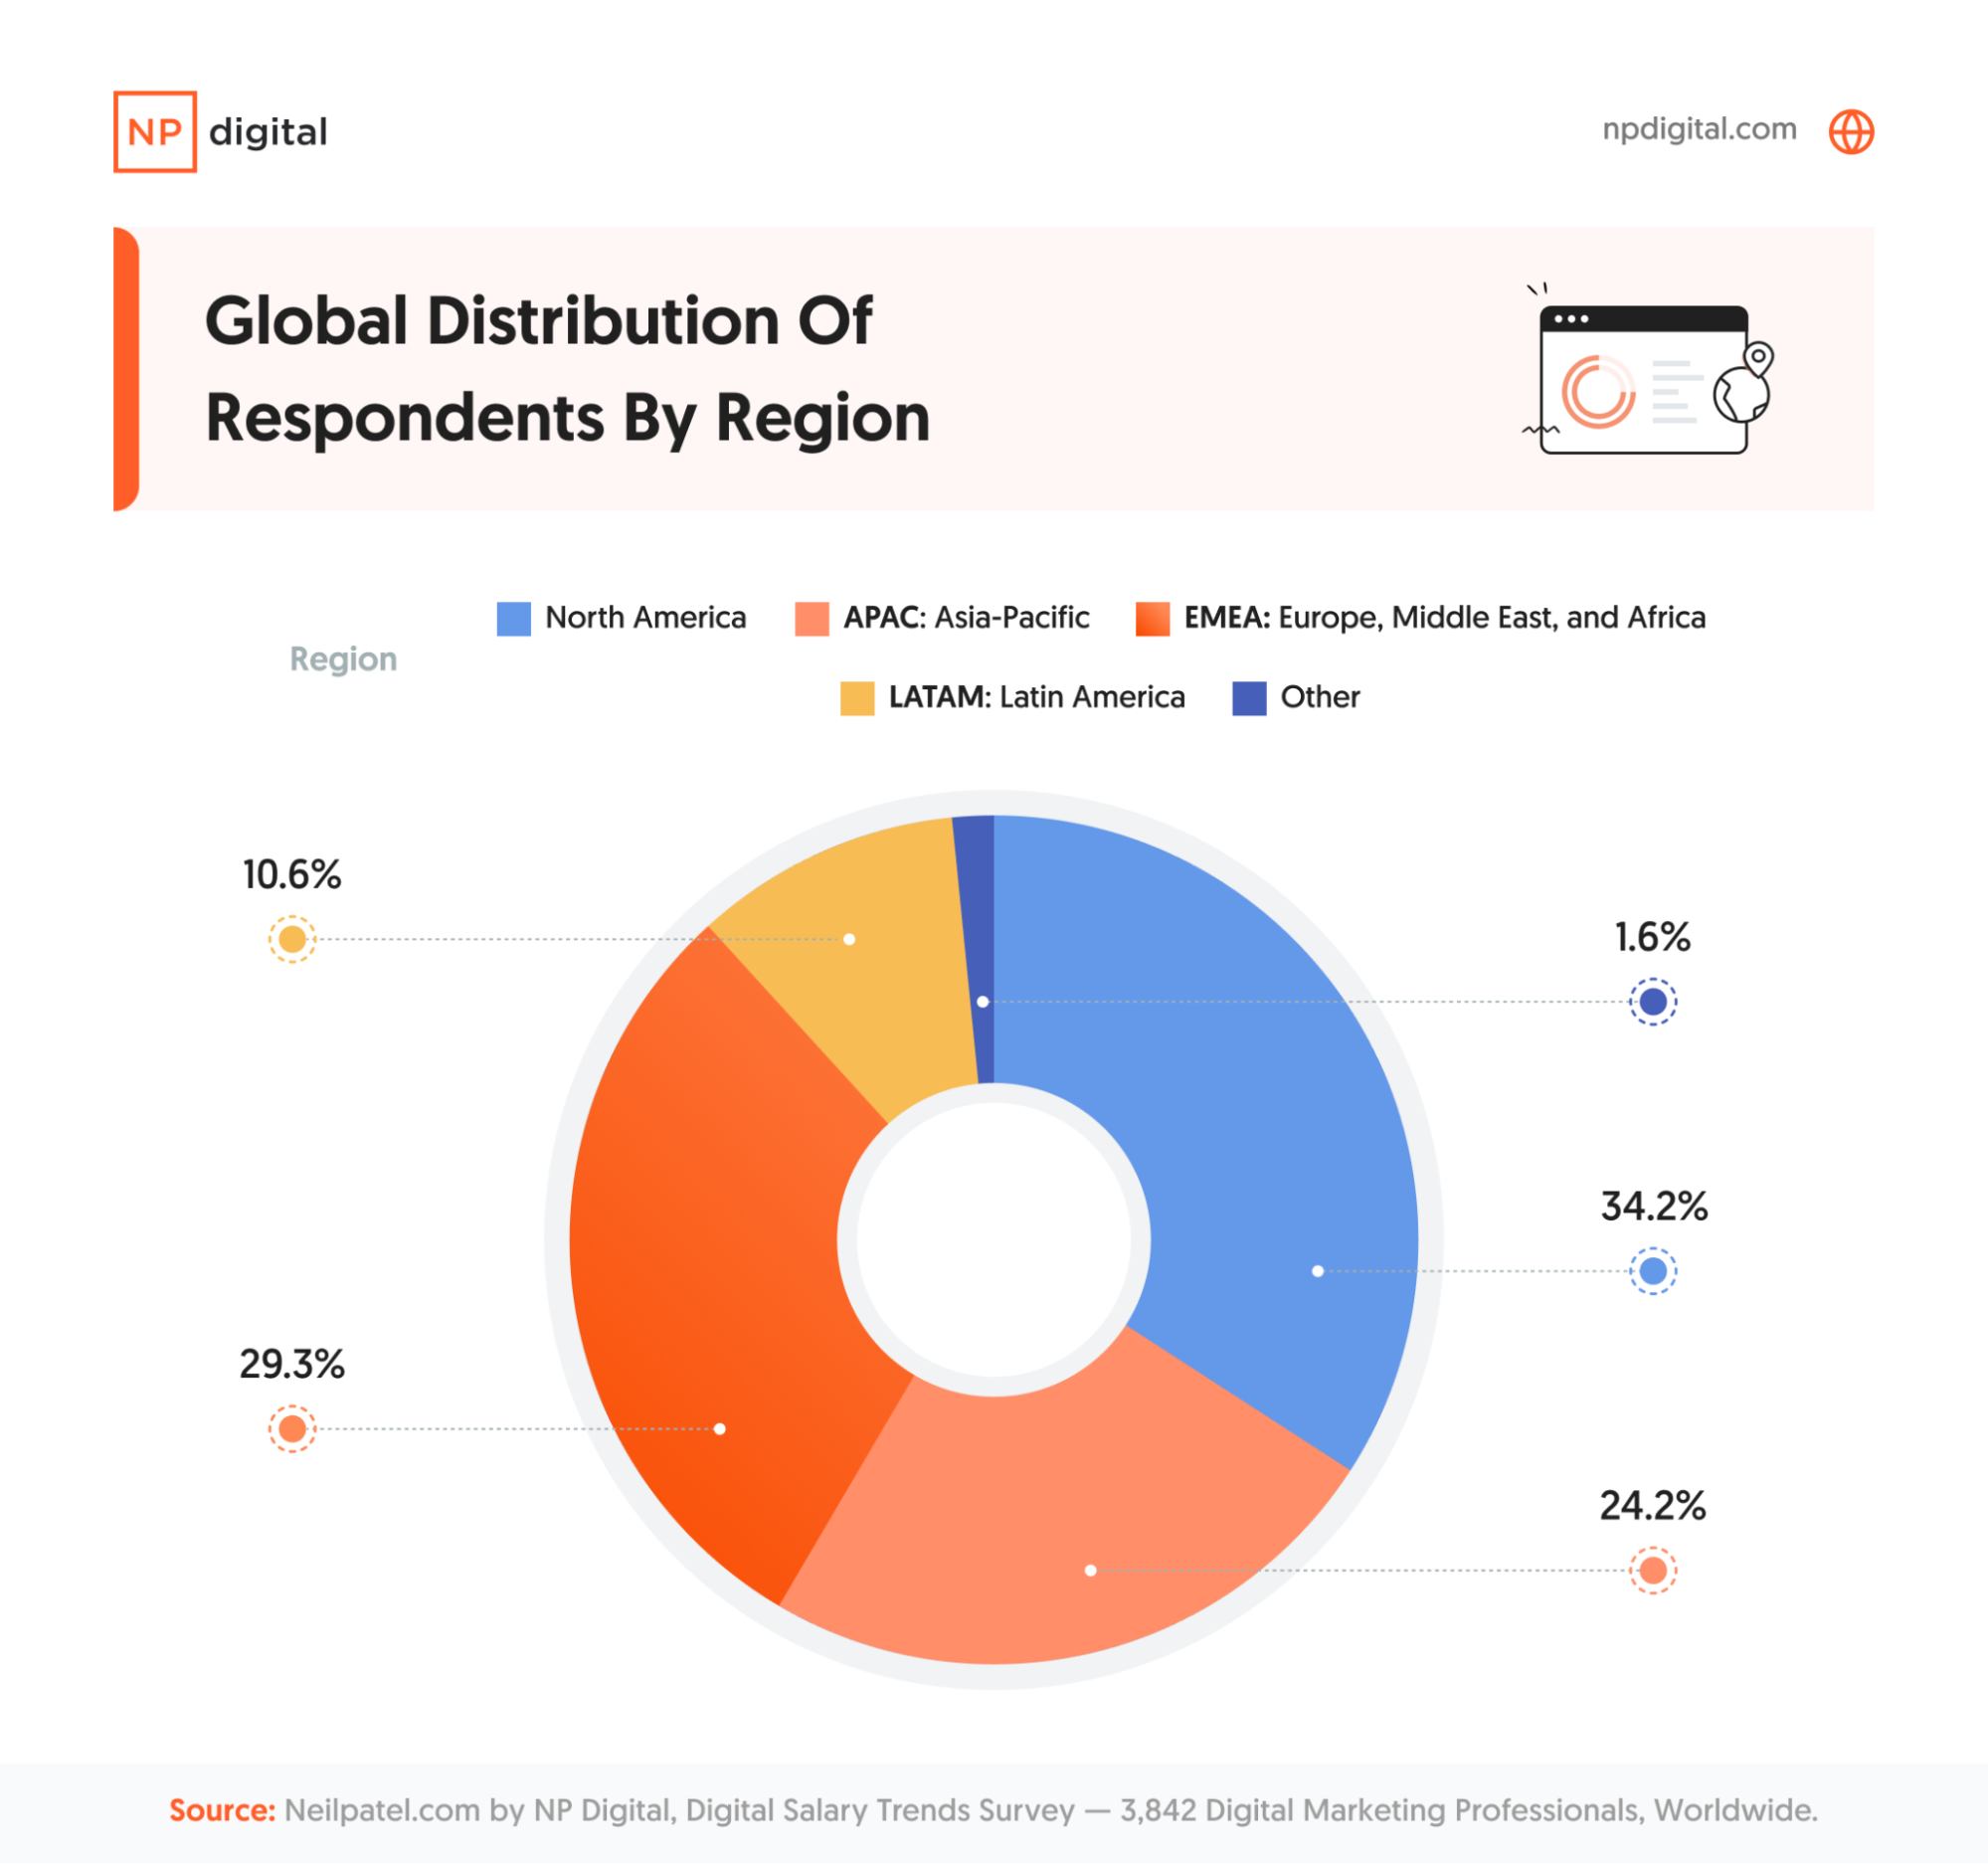
NP Digital conducted this digital marketing salary trends survey in August 2023, with more than 3,700 marketing professionals responding to our requests for assistance via email and social media.
Along with more than 100 countries represented, we also got input from marketers working in several different industries, including in-house roles, agencies and freelance roles. We started our survey by identifying questions like how many years they had been in the industry, what their compensation was, which industry they worked in, and whether they worked remotely or not.
From there, we zeroed in on what our respondents valued, including whether they were happy with their compensation, who they talked about compensation with, what benefits they prioritized, and what would cause them to leave their jobs.A note to our respondents: It was fantastic to see such a great response from digital marketers across the globe. If you participated, thank you so much for taking the time to help. Data-driven insights like those we extracted from our survey are instrumental in opening discussions about compensation that benefit everyone in the long term.

See How My Agency Can Drive More Traffic to Your Website
- SEO - unlock more SEO traffic. See real results.
- Content Marketing - our team creates epic content that will get shared, get links, and attract traffic.
- Paid Media - effective paid strategies with clear ROI.
Are You Using Google Ads? Try Our FREE Ads Grader!
Stop wasting money and unlock the hidden potential of your advertising.
- Discover the power of intentional advertising.
- Reach your ideal target audience.
- Maximize ad spend efficiency.
[ad_2]
Article link